2023-03-21 / Bairui SU
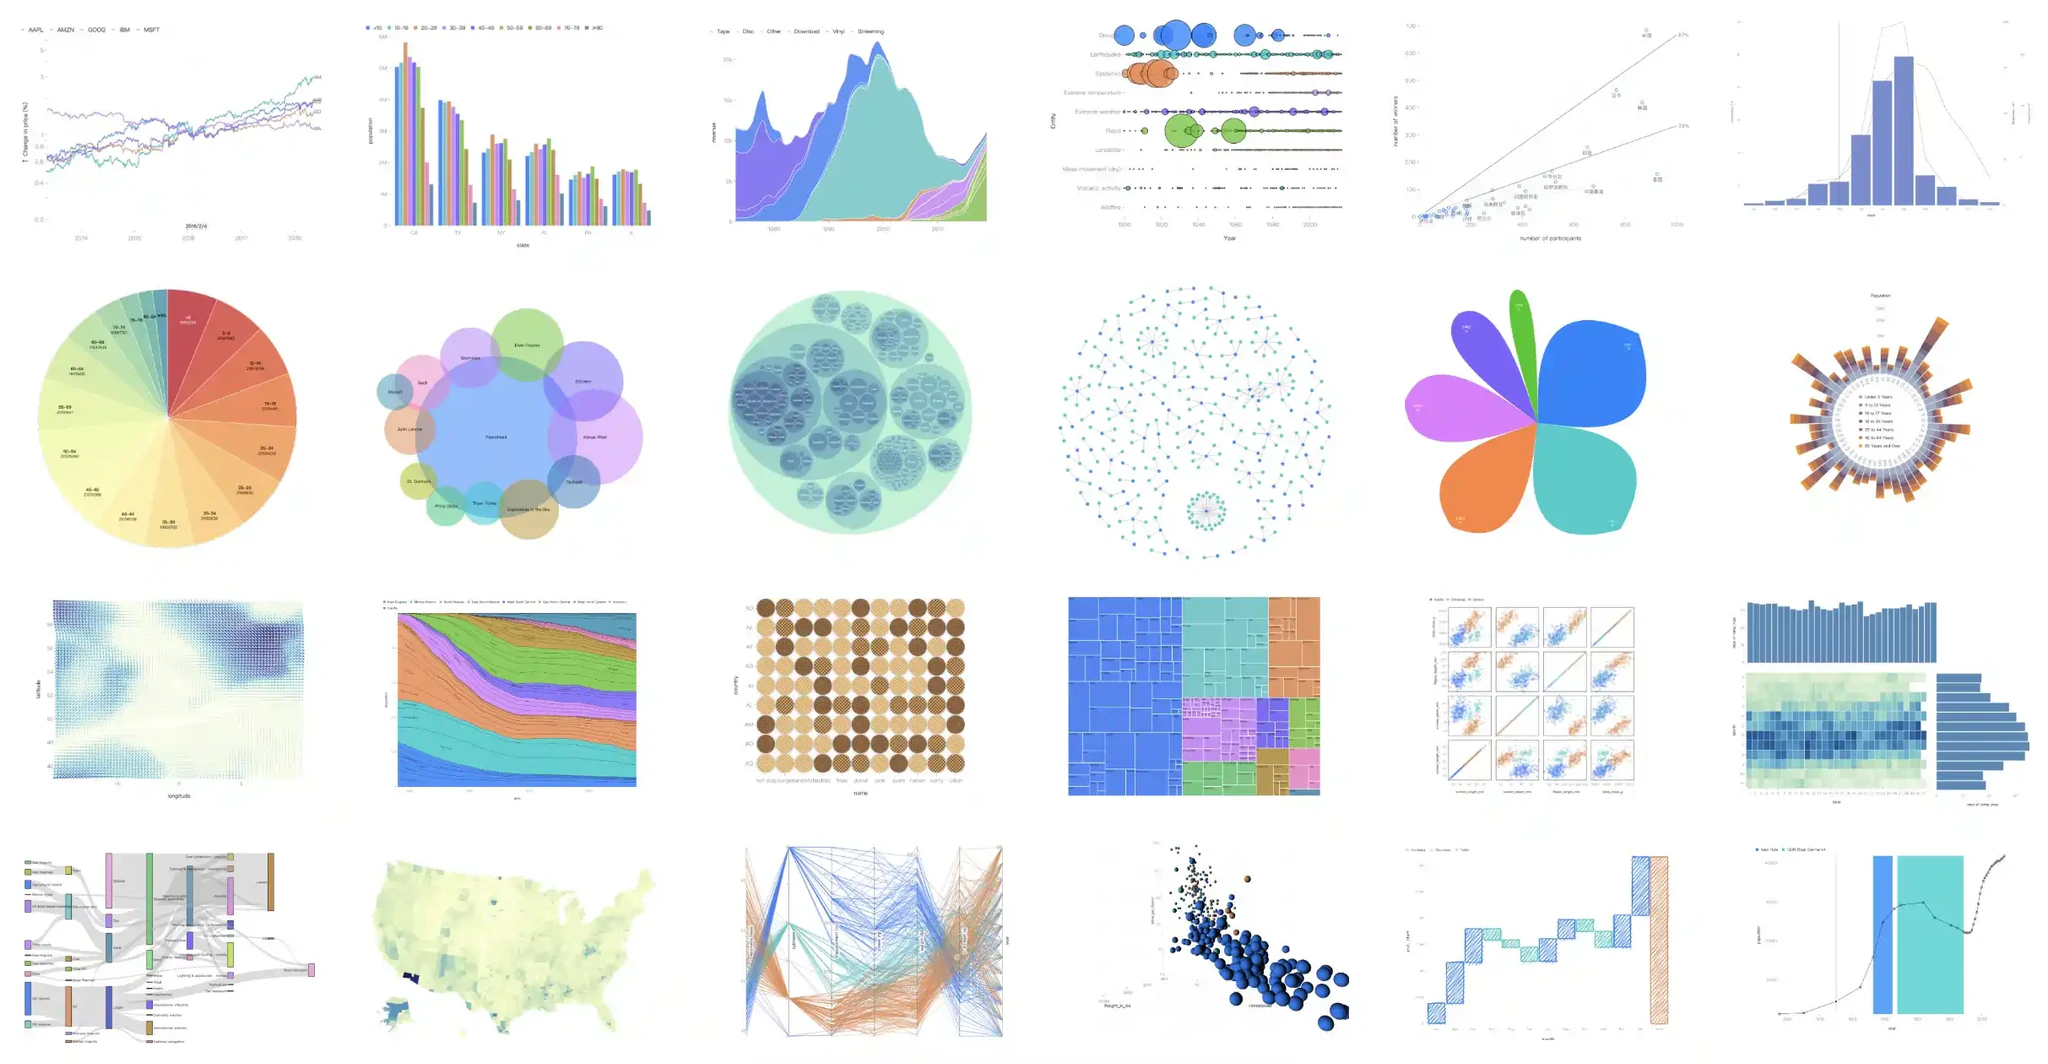
AntV G2 is a free, open-source, JavaScript library for interactive data visualization. Inspired by The Grammar of Graphics, it enables developers to construct expressive, reusable visualizations through composable primitives rather than predefined charts.
I worked as the project leader of AntV G2 5.0, focusing on the design and implementation of its visualization grammar and rendering architecture. A key challenge was creating abstractions that are flexible enough to support diverse visualization needs while remaining accessible to developers with varying levels of expertise.
Through this work, I contributed to the development of AntV G2 5.0, managing the whole open-source community, improving the documentation and examples, responding to issues and pull requests, and holding workshops and talks. At the time of writing, it has 12.5k stars on GitHub and over 1M monthly downloads on npm, and has been widely adopted in enterprise BI systems and data products, supporting a wide range of real-world analytical scenarios.
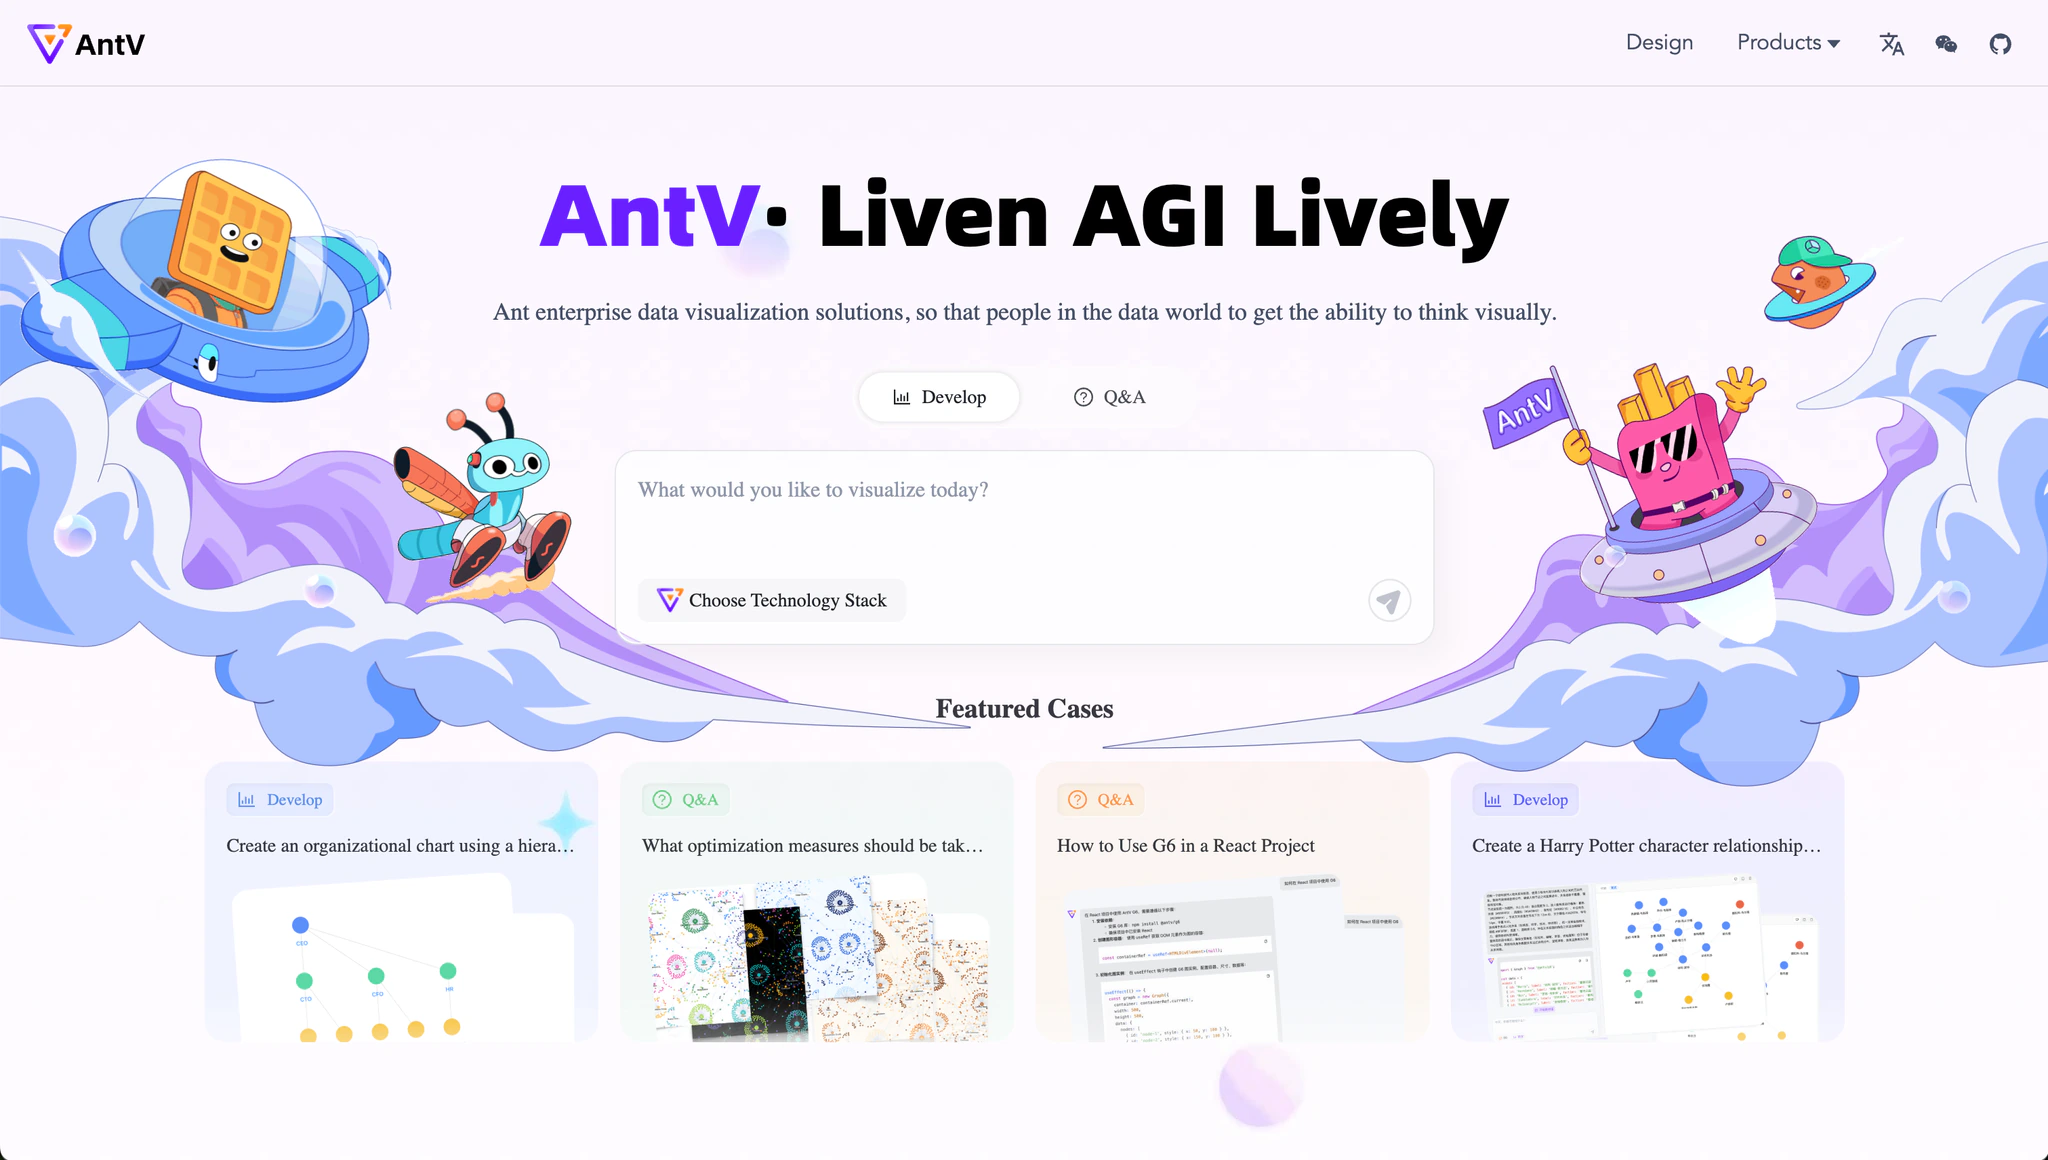 AntV G2 Website
Context
As the internal demand for visualizations in enterprise products has grown, limitations of G2’s existing architecture have become increasingly apparent. While recent research has extended the Grammar of Graphics, producing tools like Observable Plot, Vega-Lite, Atom, and Canis, G2 has faced challenges integrating these advances and remaining flexible enough for evolving industrial needs. To address this, our work aims to upgrade G2 to incorporate state-of-the-art research while maintaining industrial applicability, guided by three objectives: Concise, Comprehensive, and Progressive.
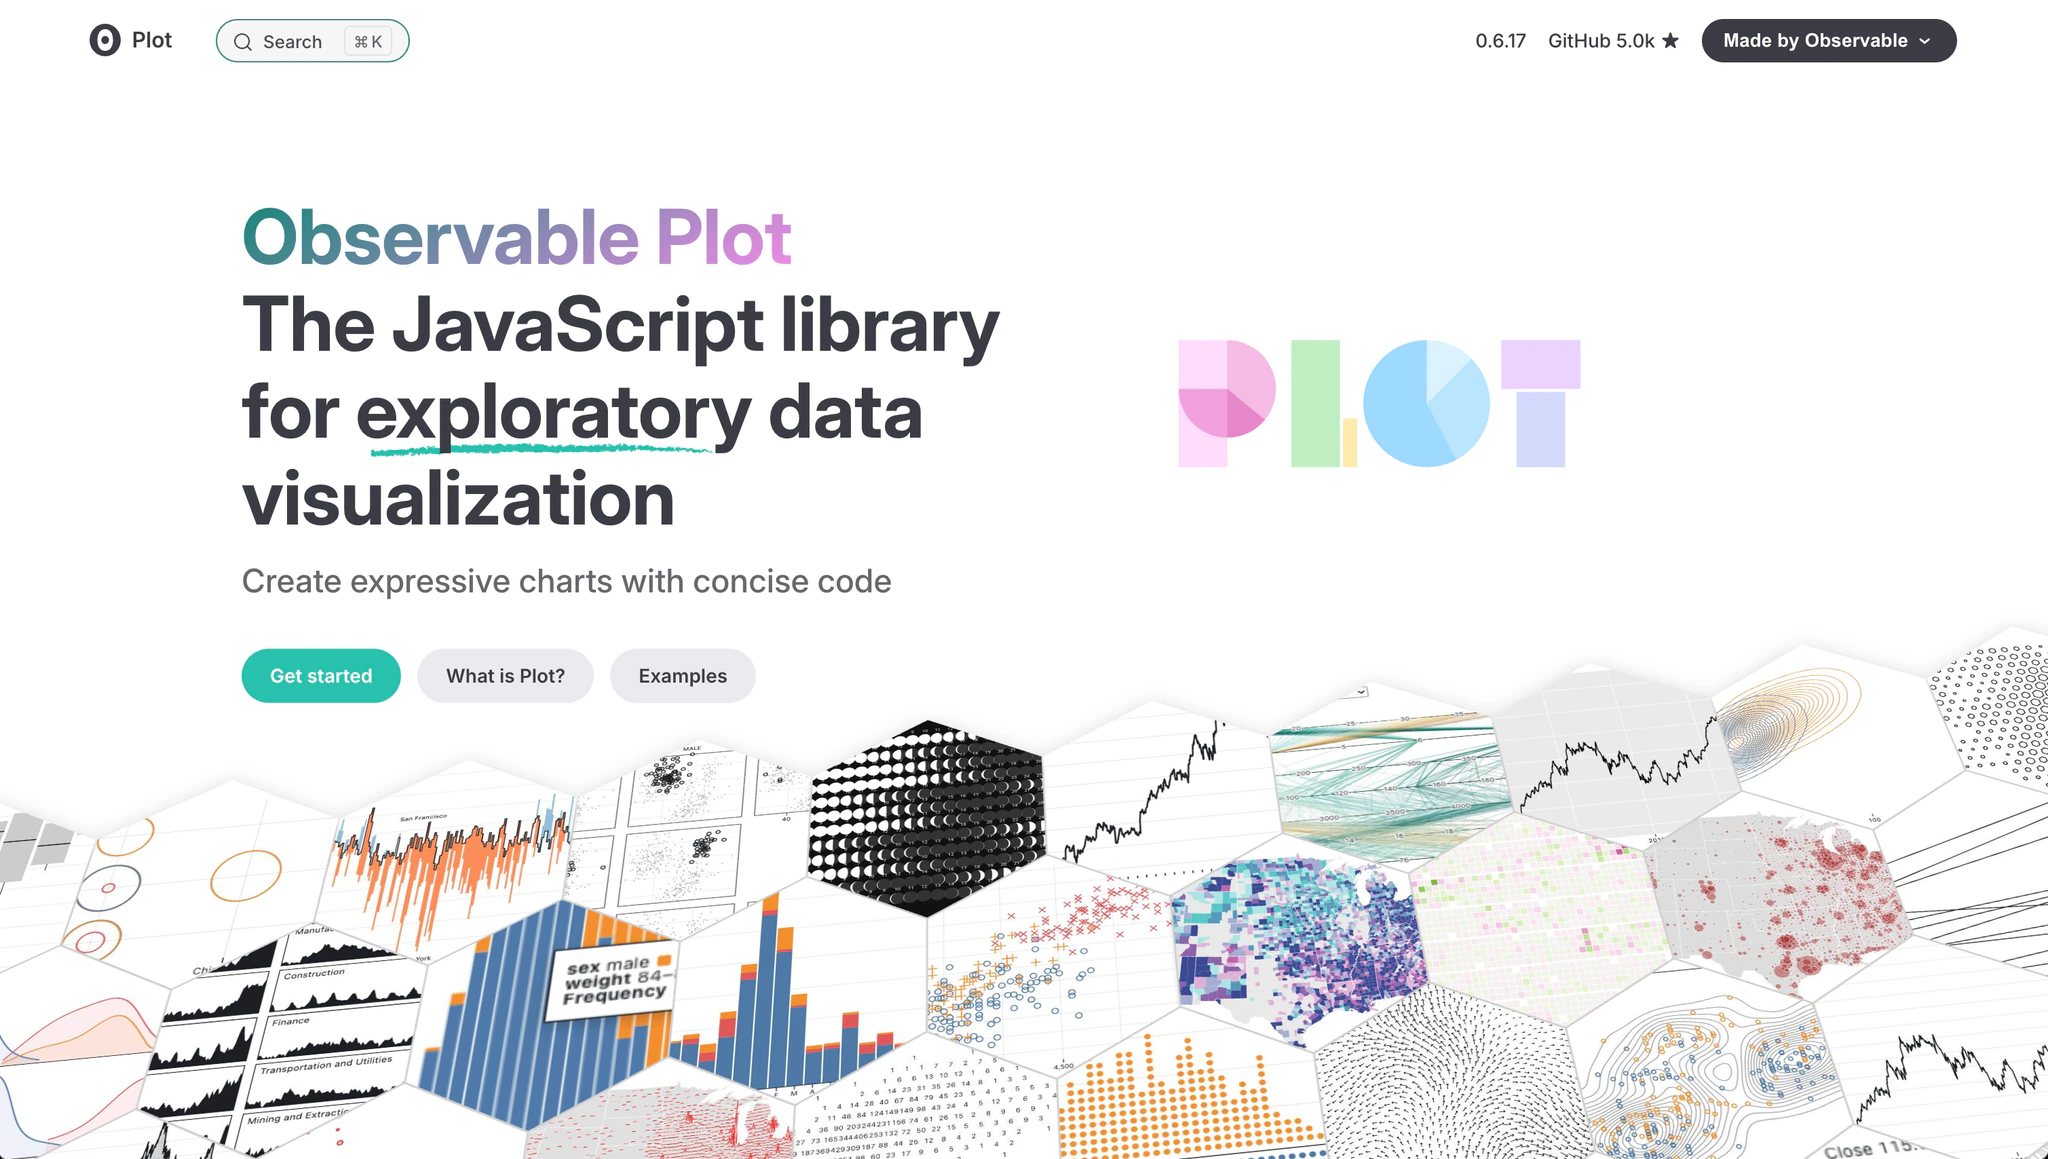 Observable Plot
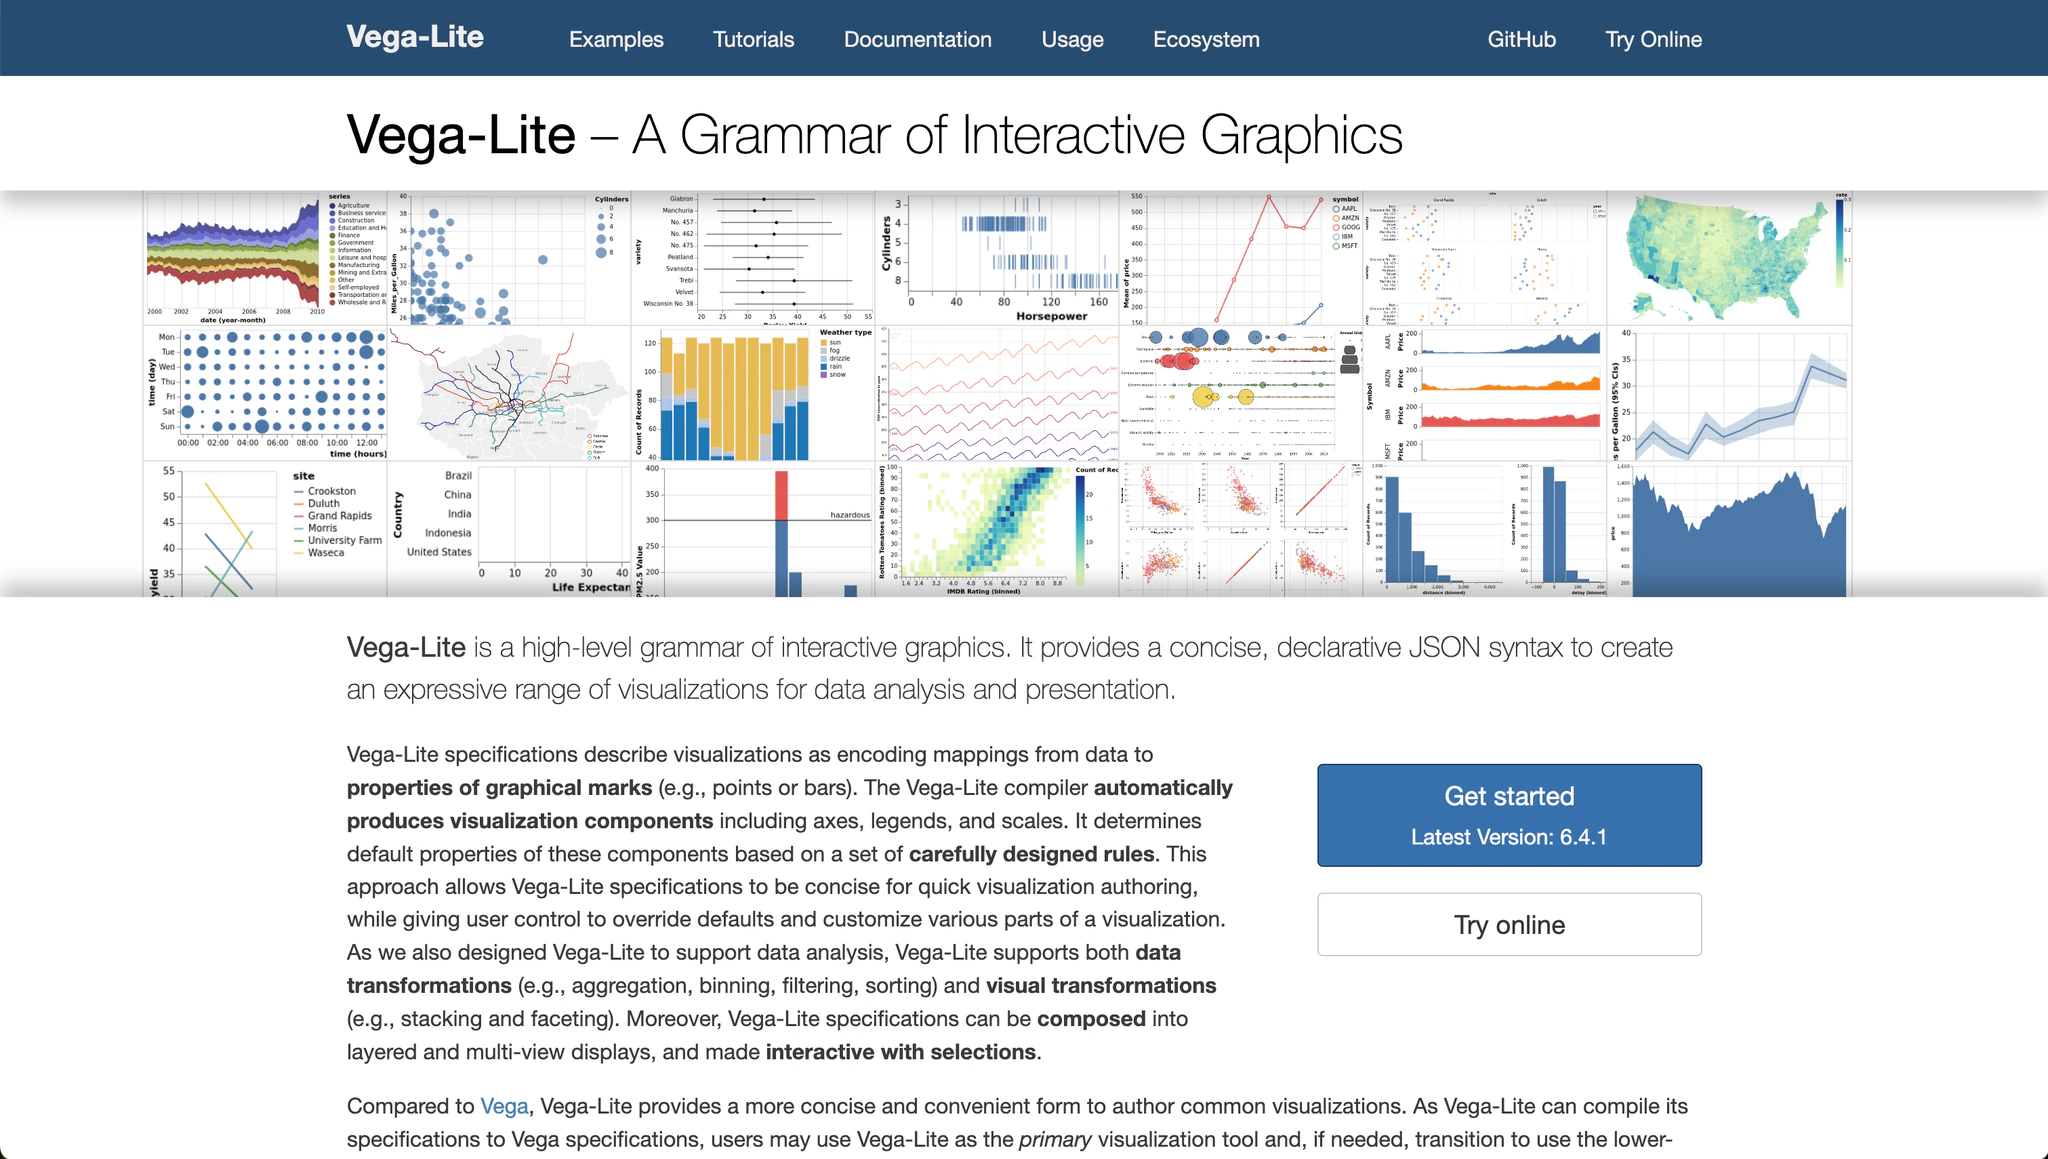 Vega-Lite
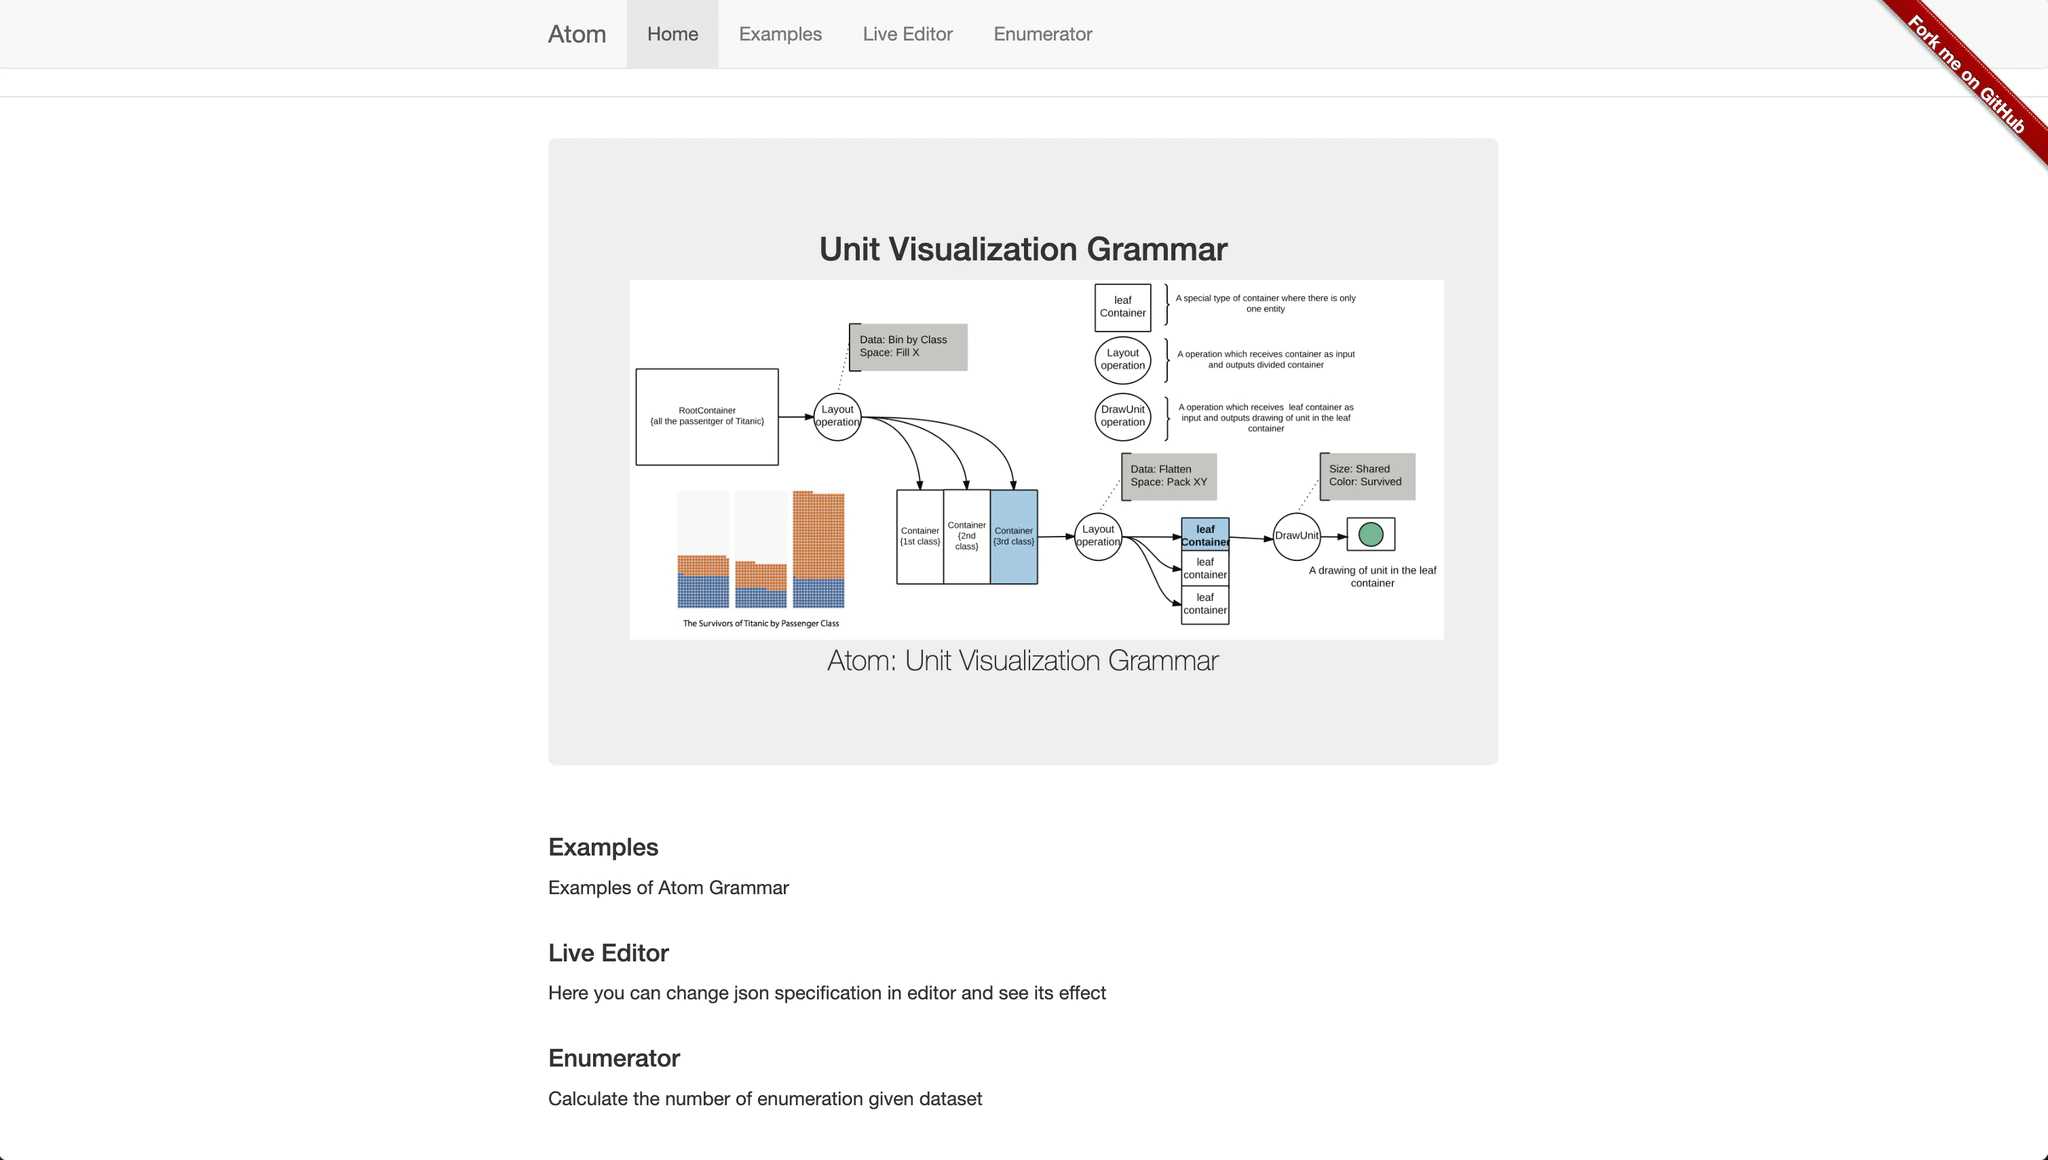 Atom
AtomDesign Challenges
The biggest challenge for visualization tools is balancing expressiveness and efficiency. Low-level toolkit like D3.js offer maximum flexibility but have a steep learning curve, while high-level chart libraries like Highcharts simplify usage at the cost of flexibility.
Inspired by Wilkinson's The Grammar of Graphics, G2 rejects predefined chart types and instead provides composable visualization components such as geometries, statistics, scales, and coordinates. This approach enables developers to create a wide range of charts with a relatively low learning curve, which contributed to G2's popularity after its open-source release in 2017. However, how to integrate the latest research and remain flexible enough for evolving industrial needs is still a challenge.
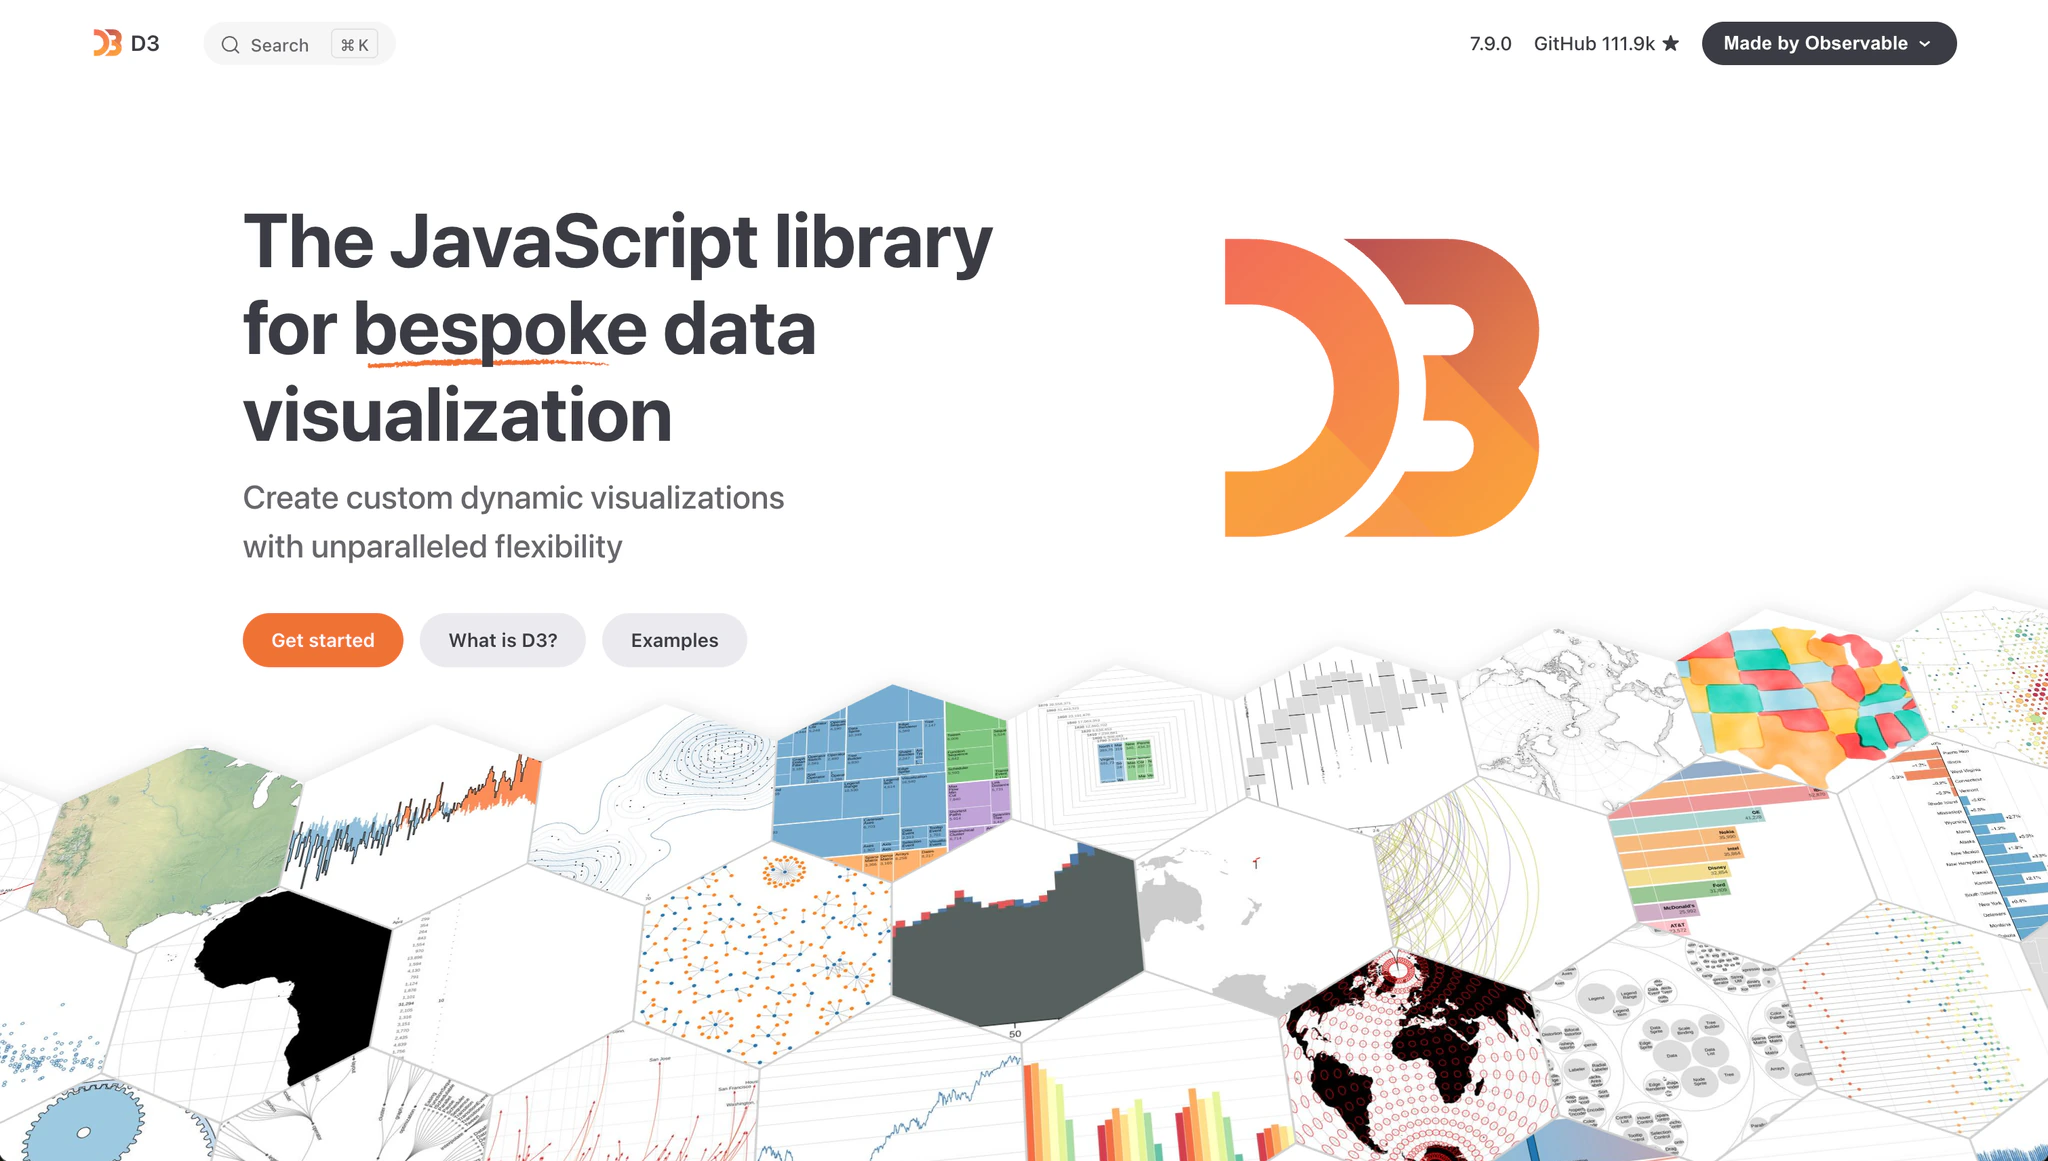 D3.js
D3.js Highcharts
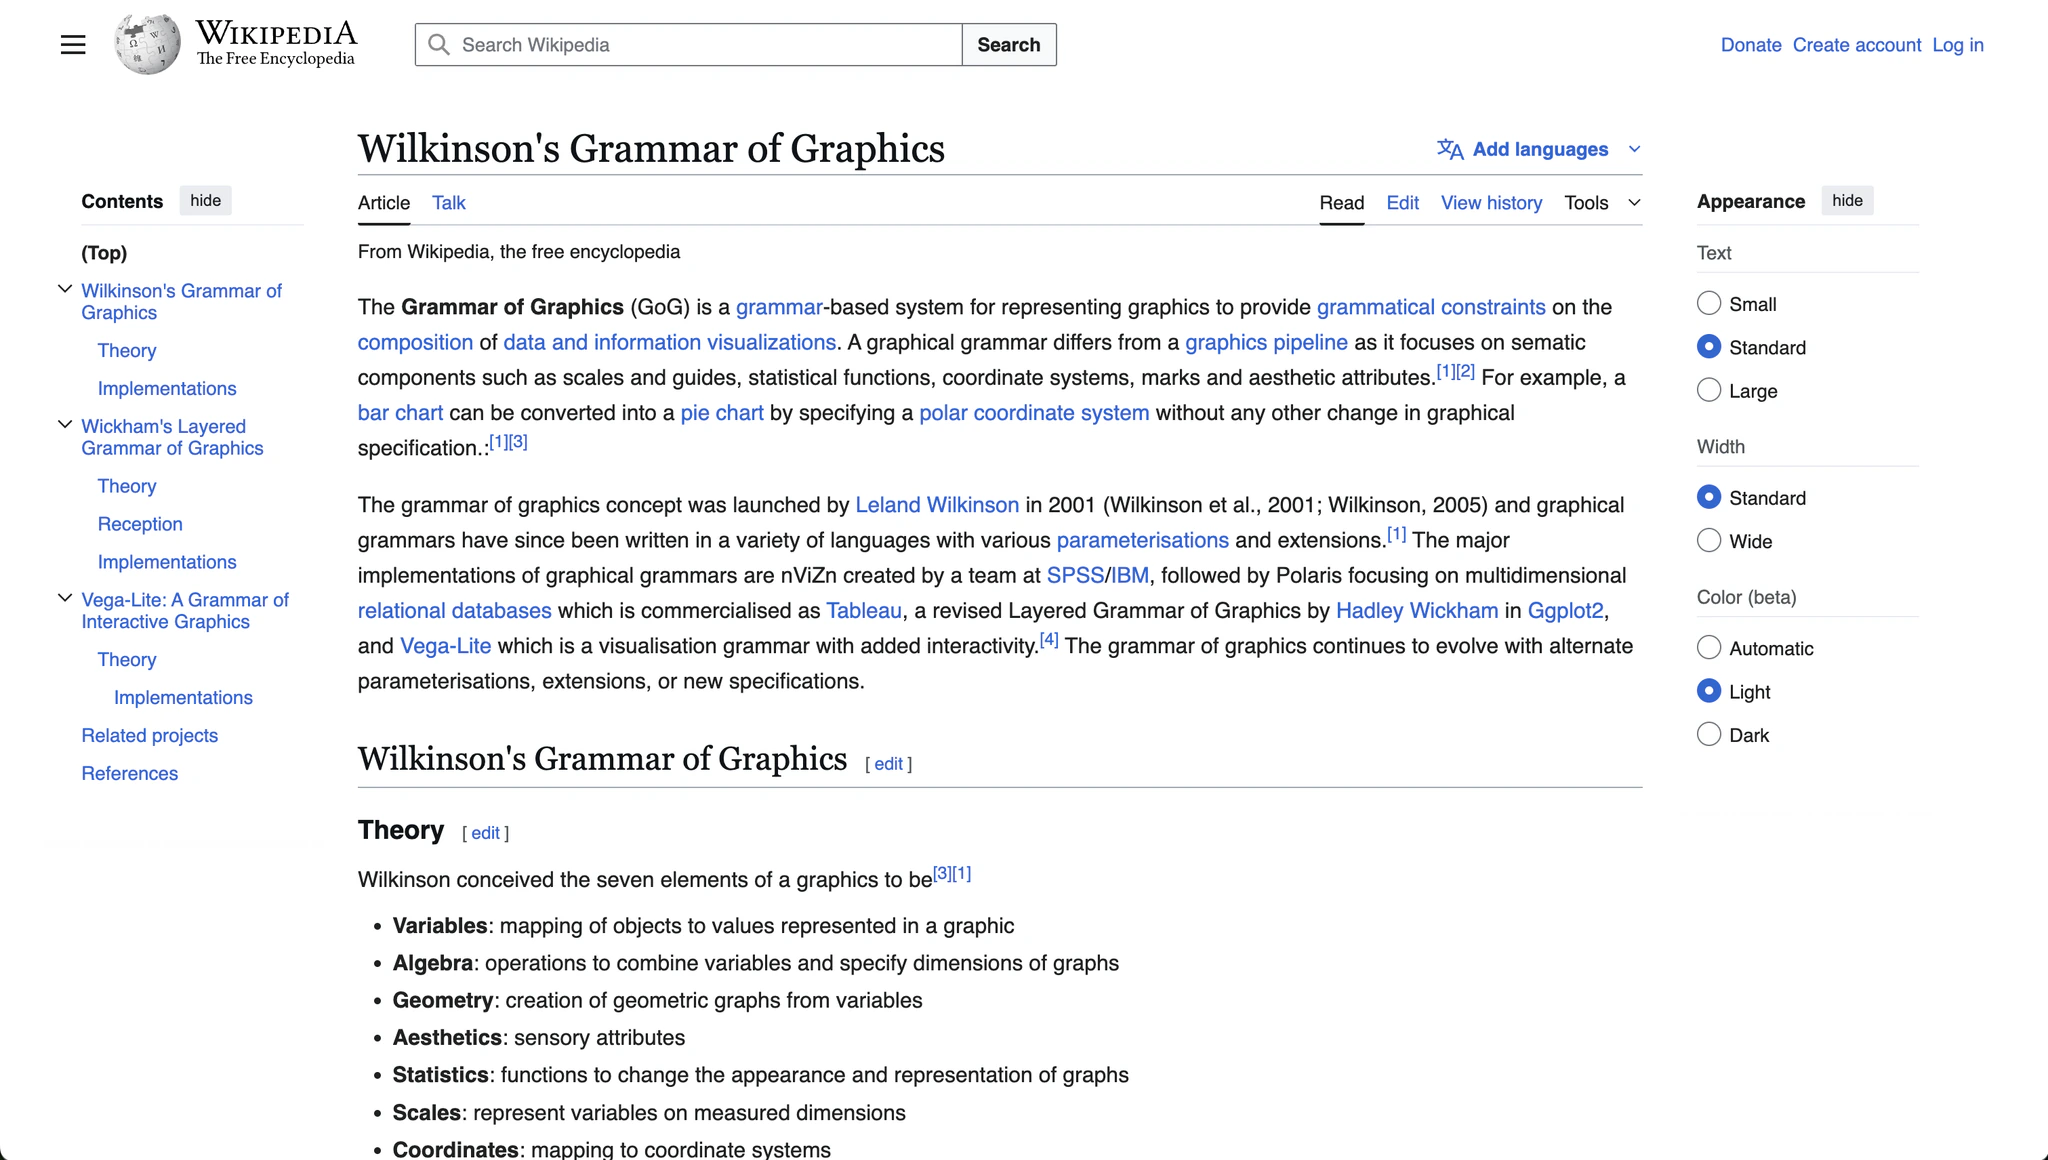 The Grammar of Graphics
Contributions
My major contributions to AntV G2 5.0 are design and implementation of the new architecture and API, as well as the migration of the existing codebase to the new architecture.
Tutorials
Before writing code, I wrote a tutorial about how to write a mini plot library called Sparrow from scratch, which is a good way to learn core concepts of data visualization and apply them to real data analysis tasks. After I published the tutorial, a lot of people read it and wanted to contribute to G2's open-source community. This is also a good preparation for me to implement G2 from scratch.
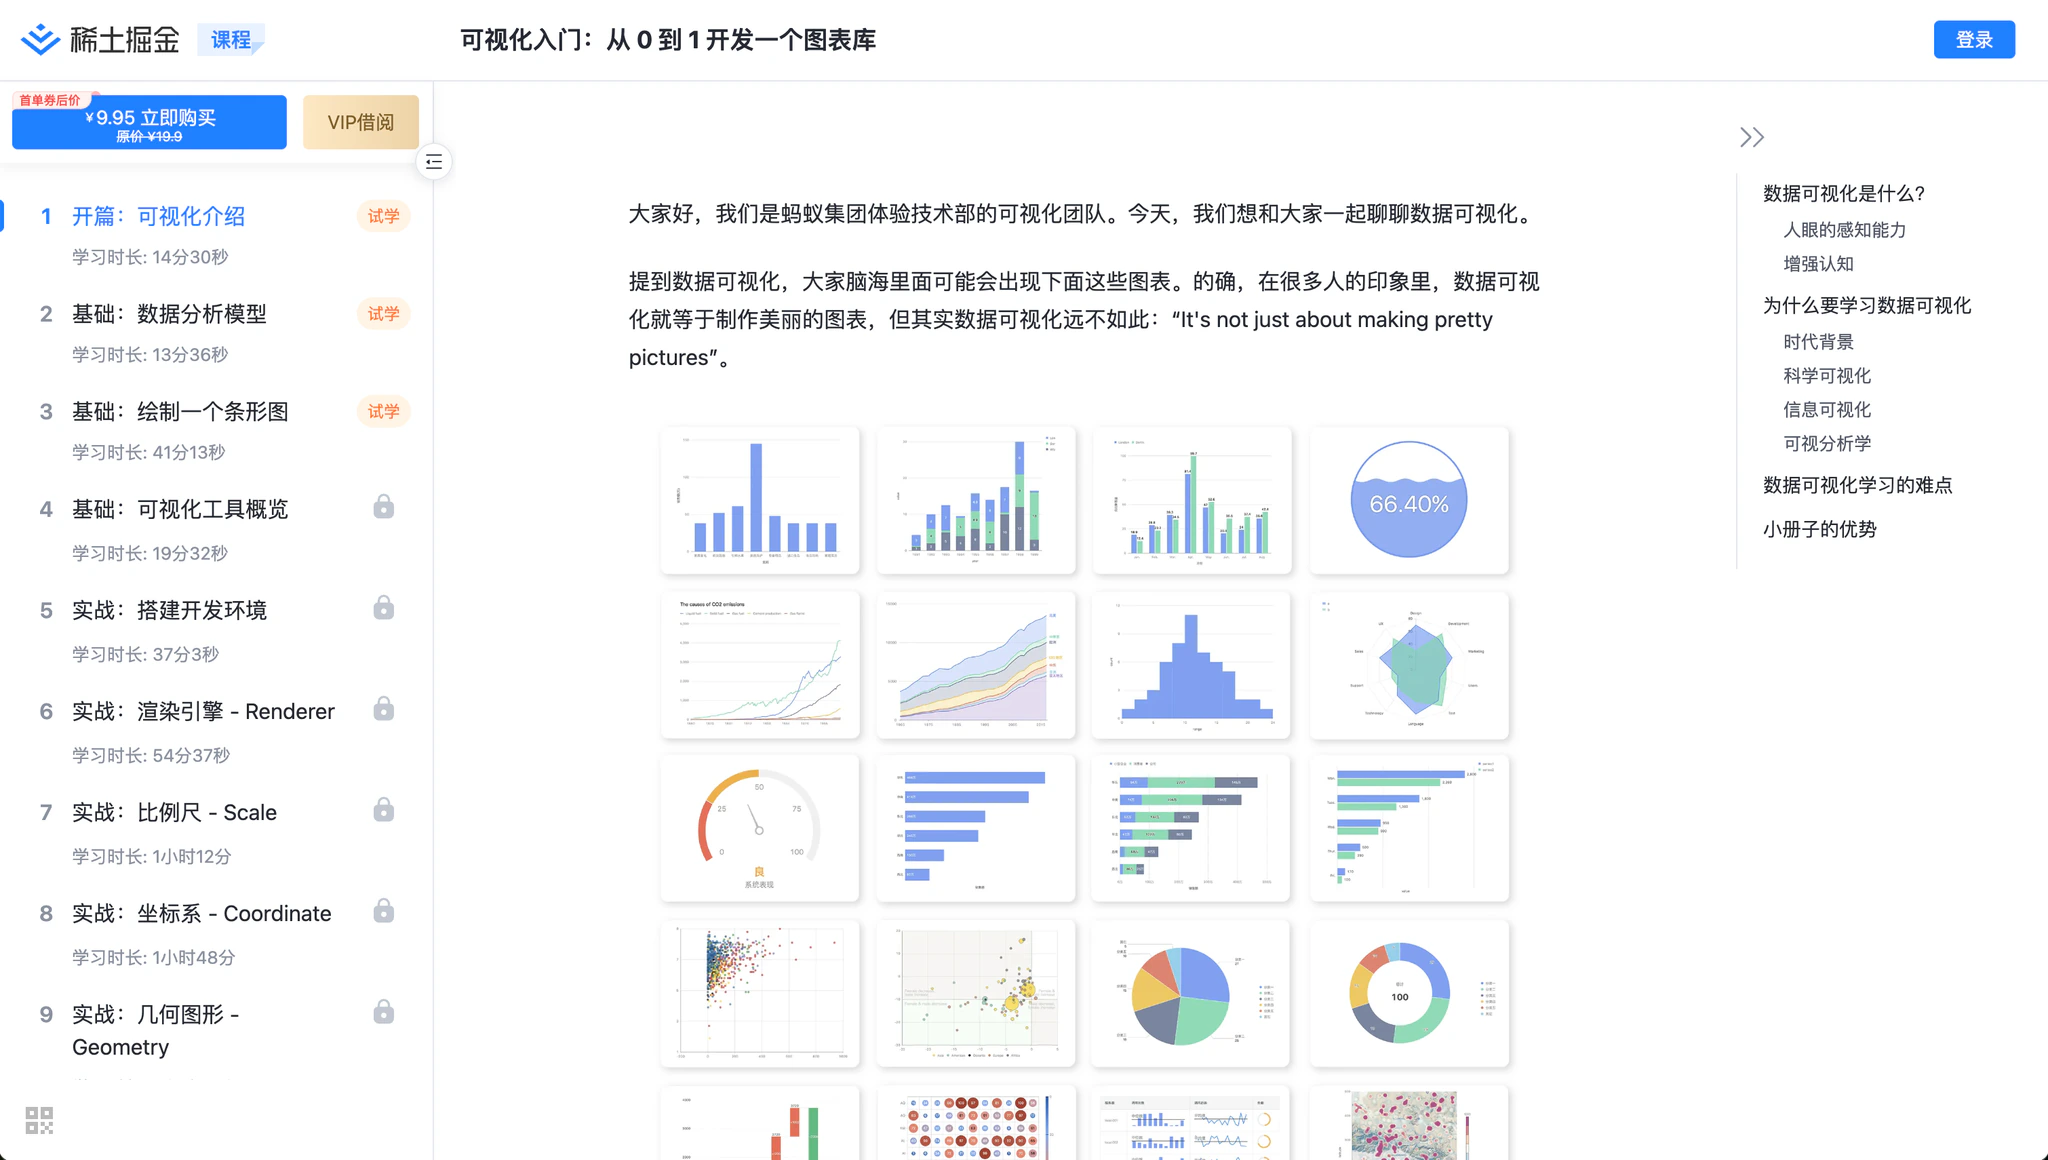 Sparrow Tutorial in Juejin
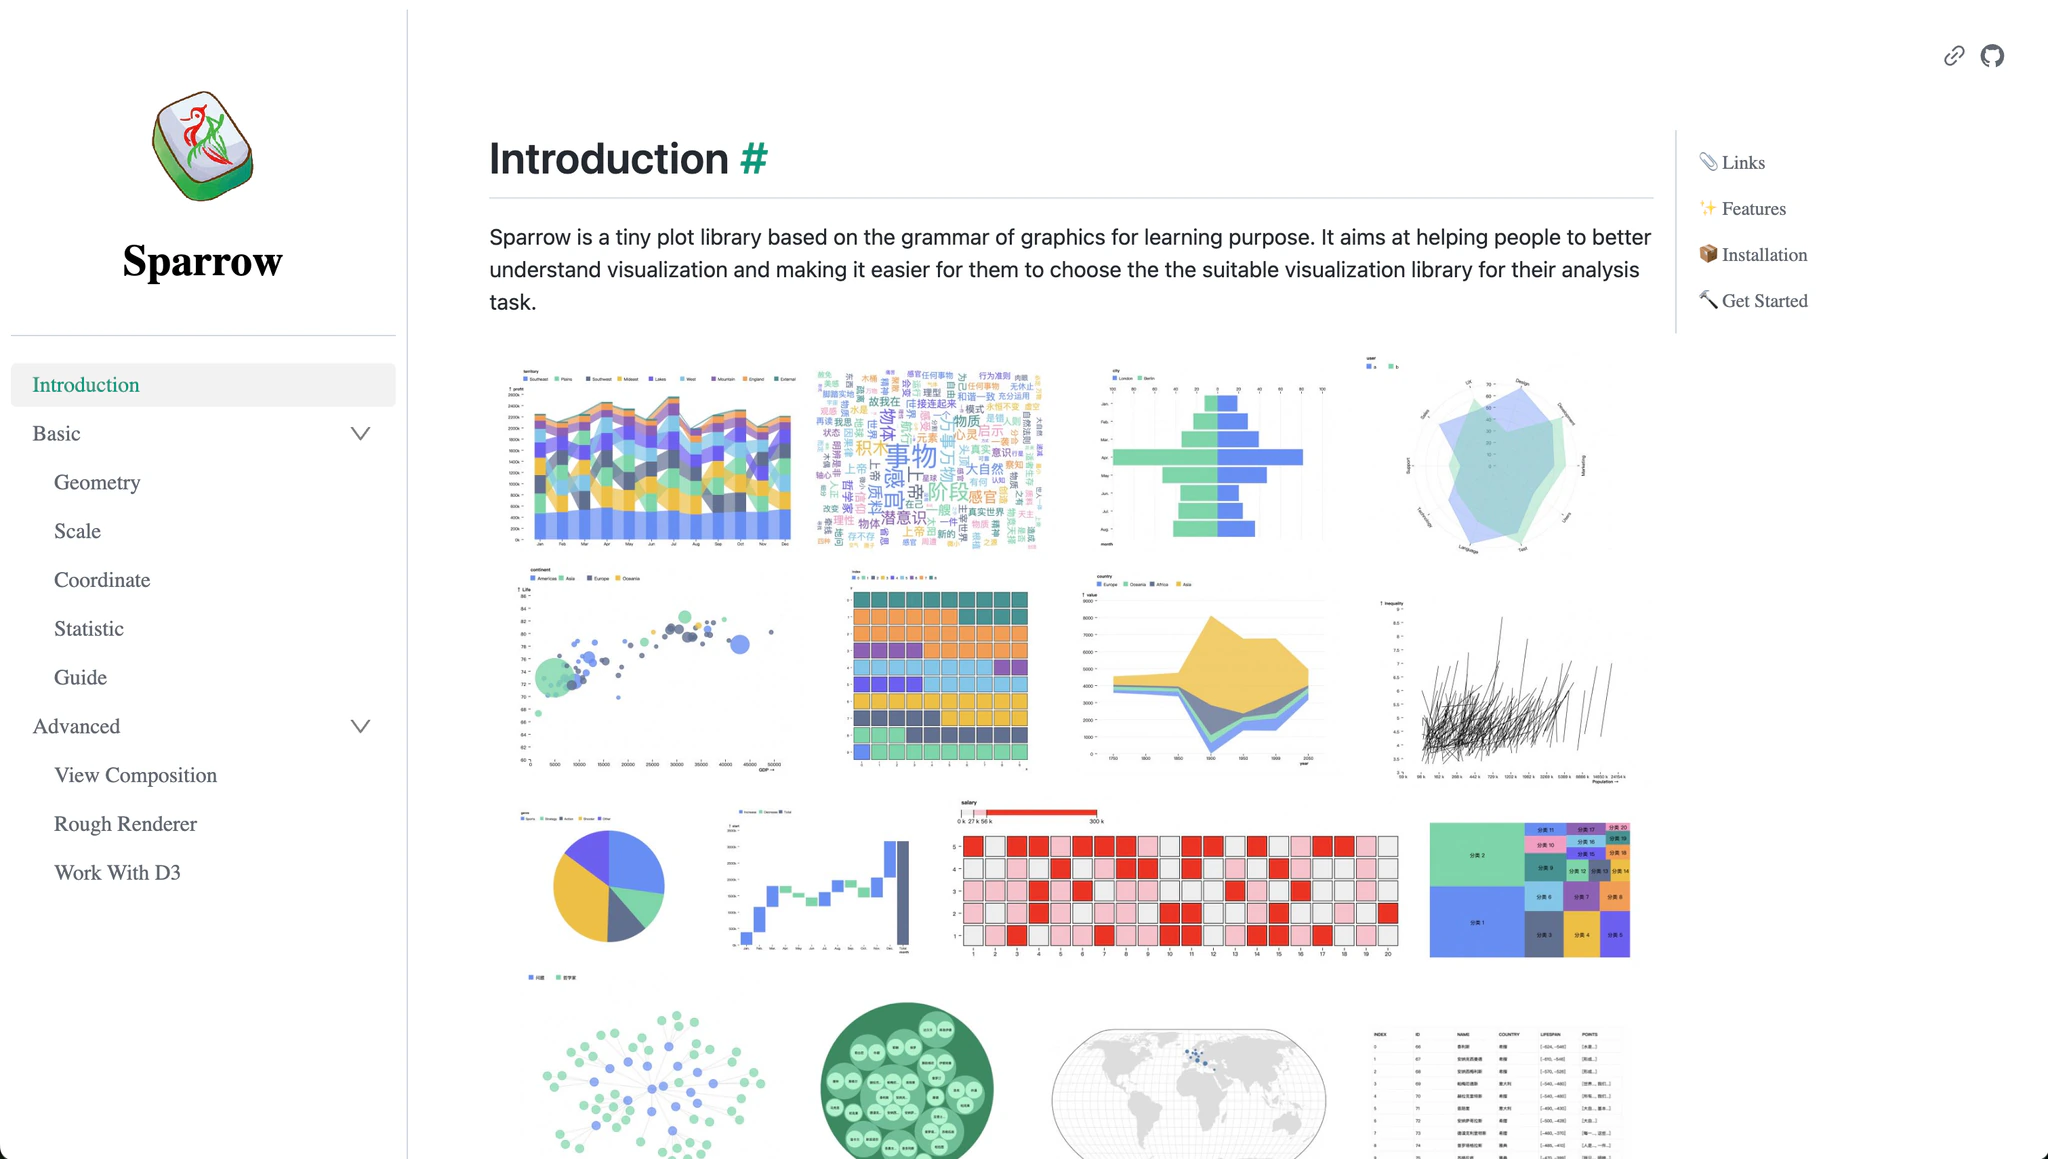 Sparrow Website
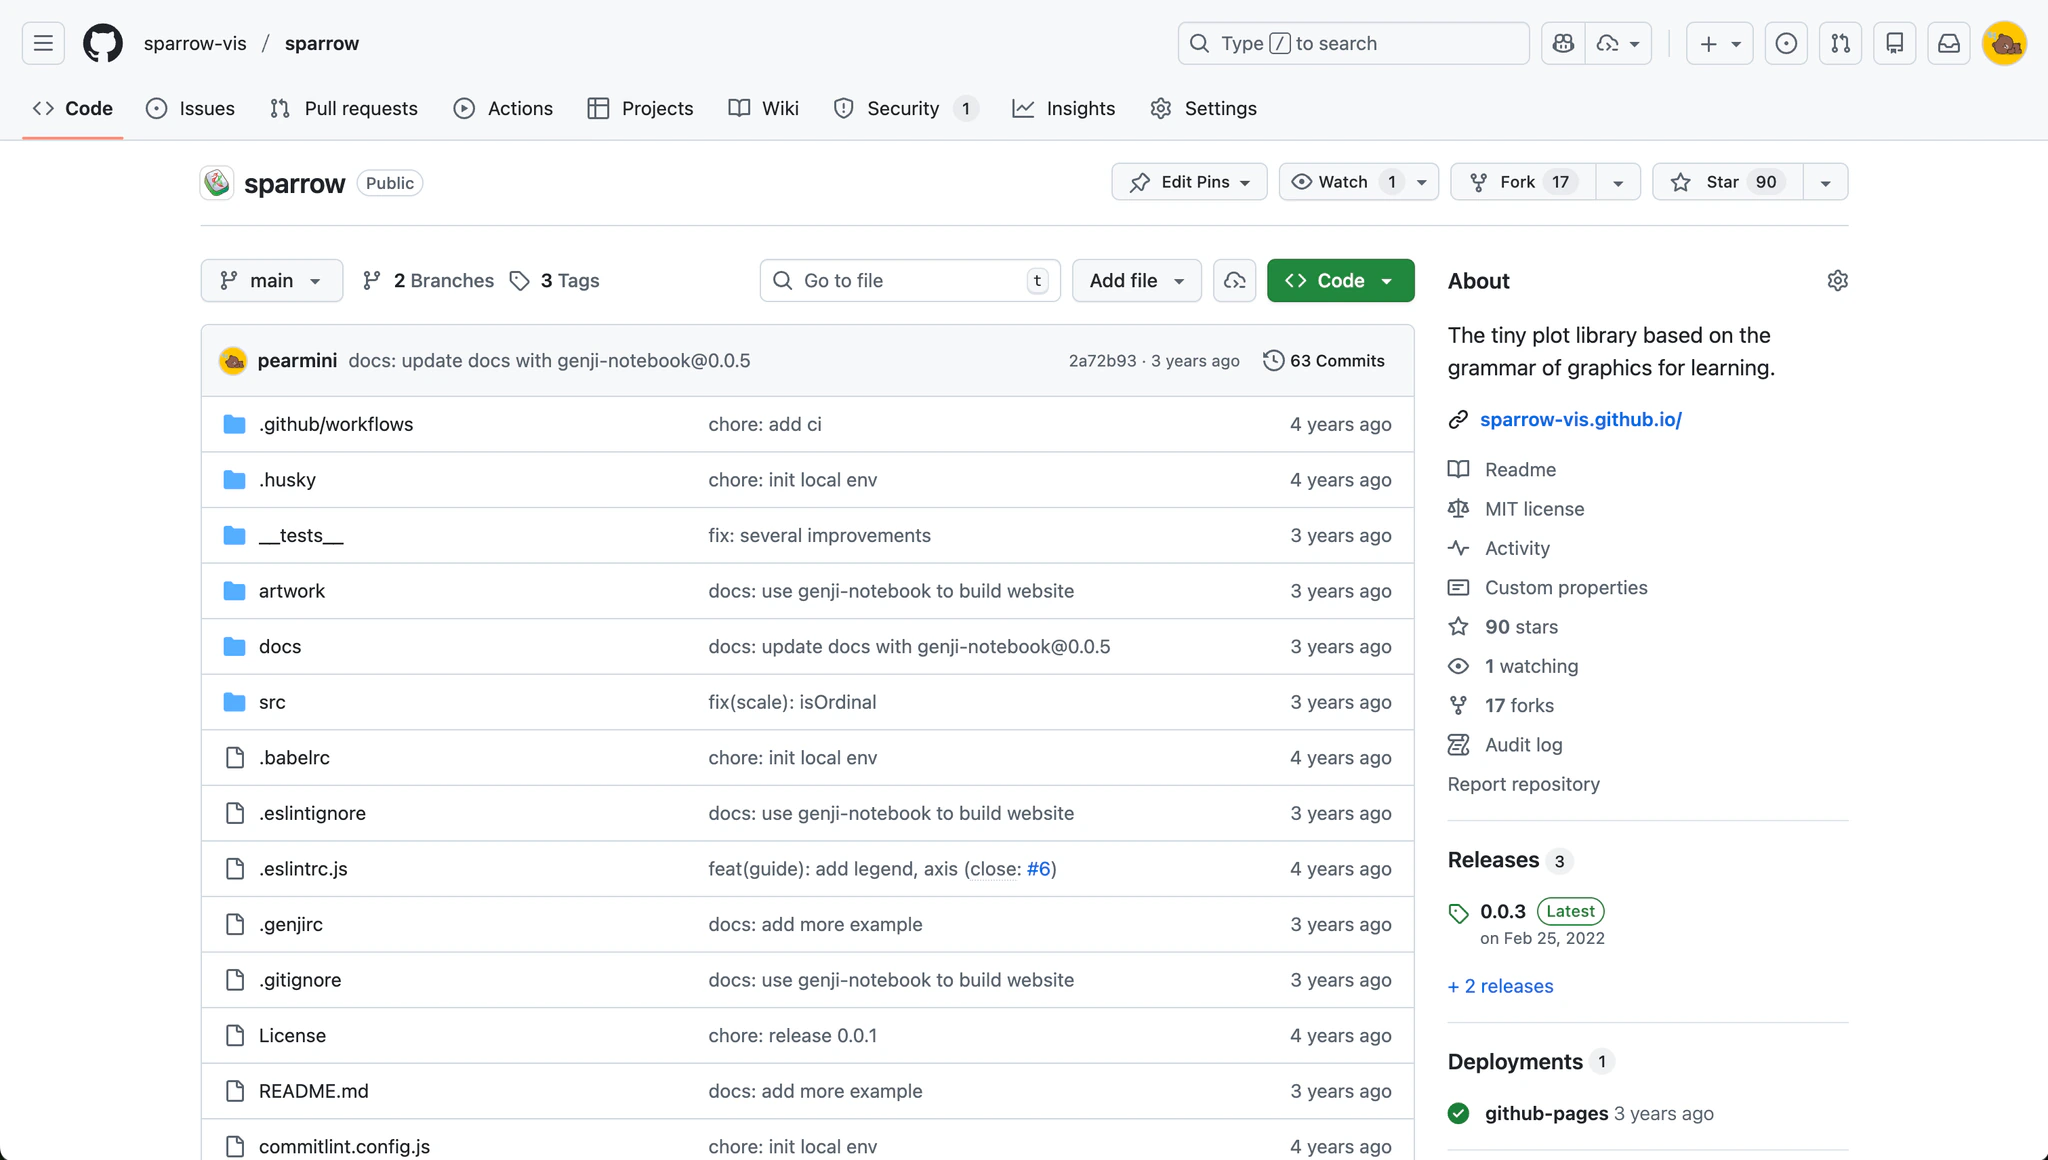 Sparrow Github Repository
Helper libraries
After writing the tutorial, I first implemented two very important helper libraries for G2: AntV Scale and AntV Coord. AntV Scale is a toolkit for mapping abstract data into visual representation, and AntV Coord is a toolkit for apply point transformations for vector graphics. Both of them play a crucial role in mapping data to pixels. So I wanted to make them reliable and performant.
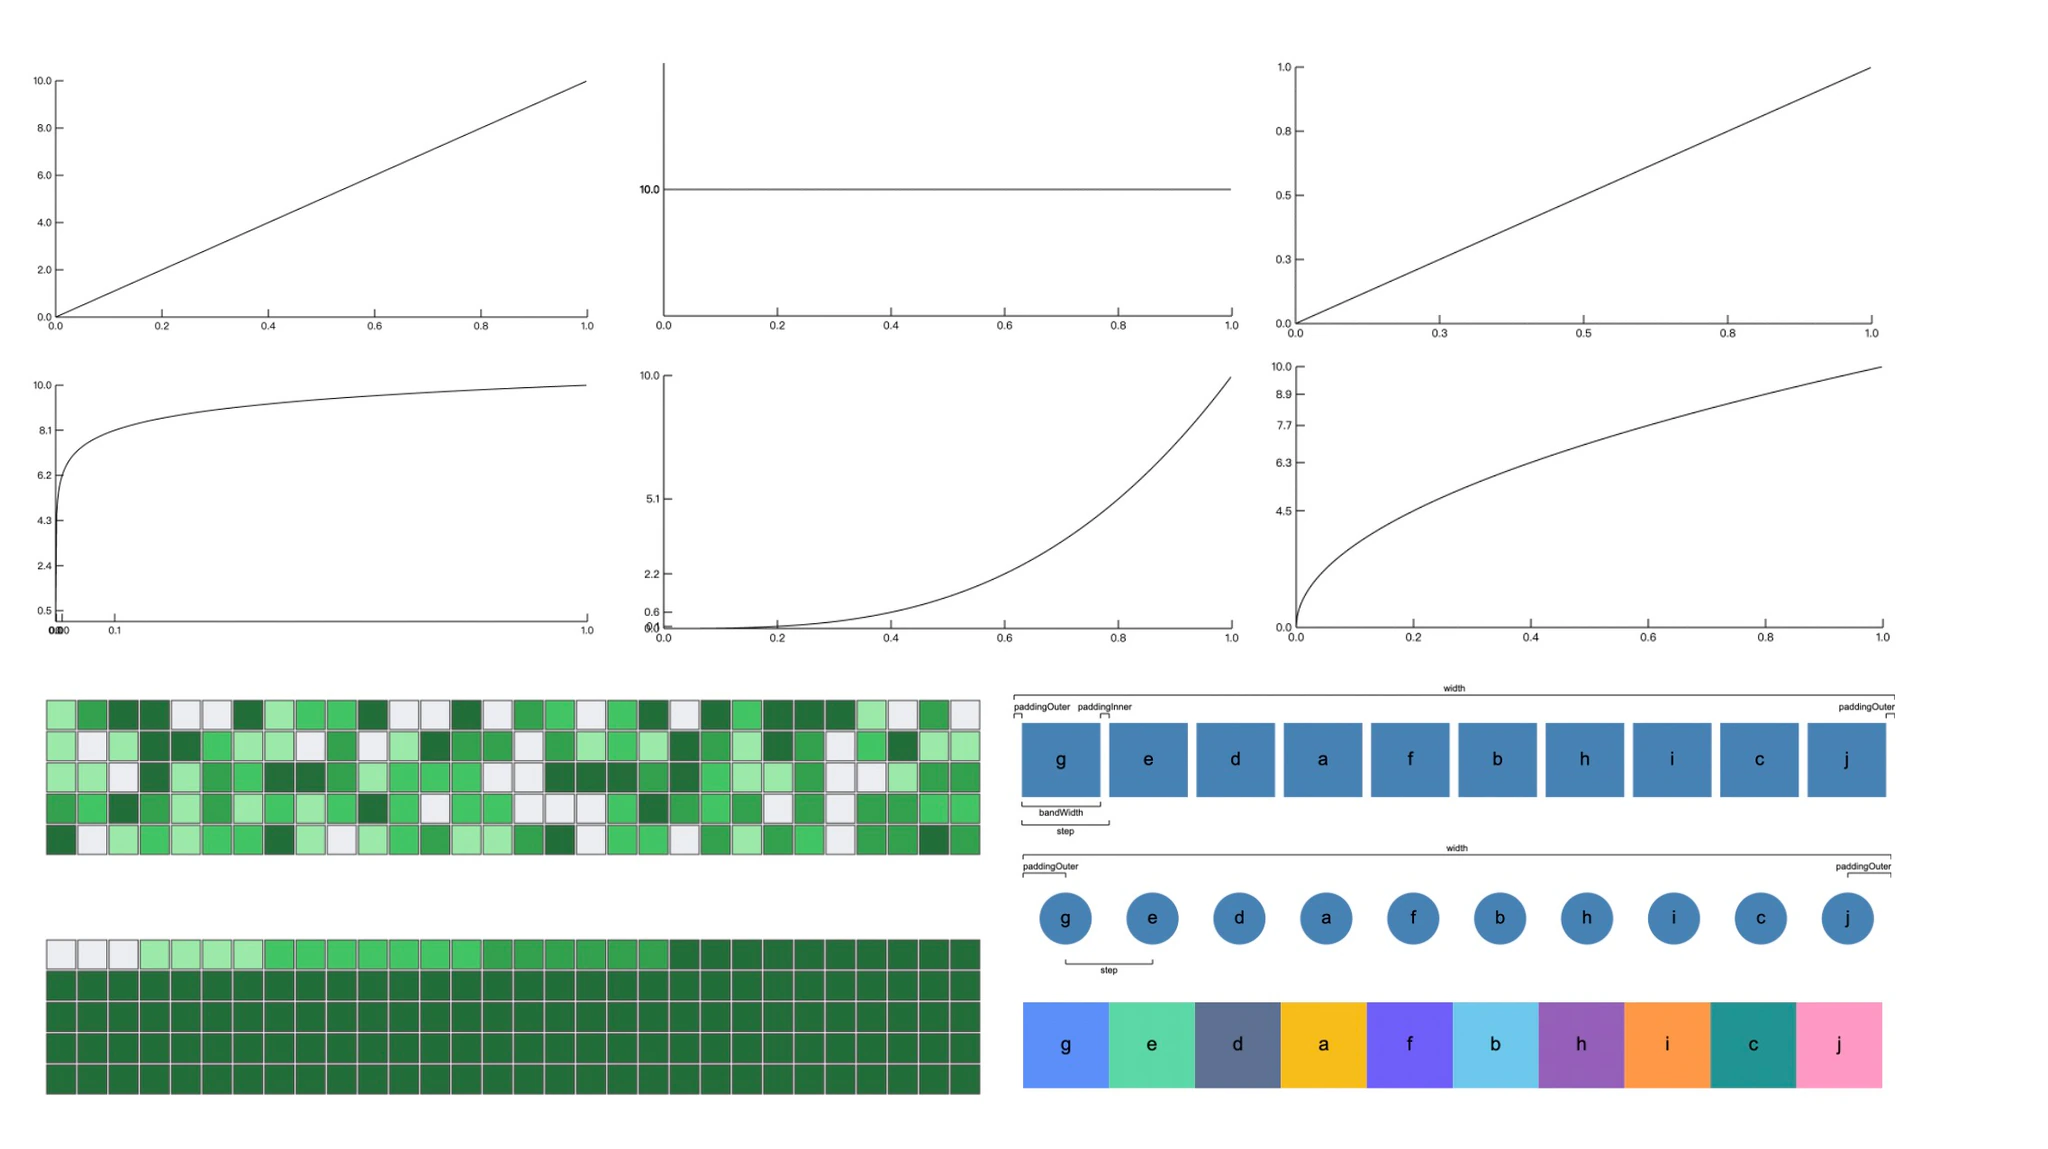 AntV Scale
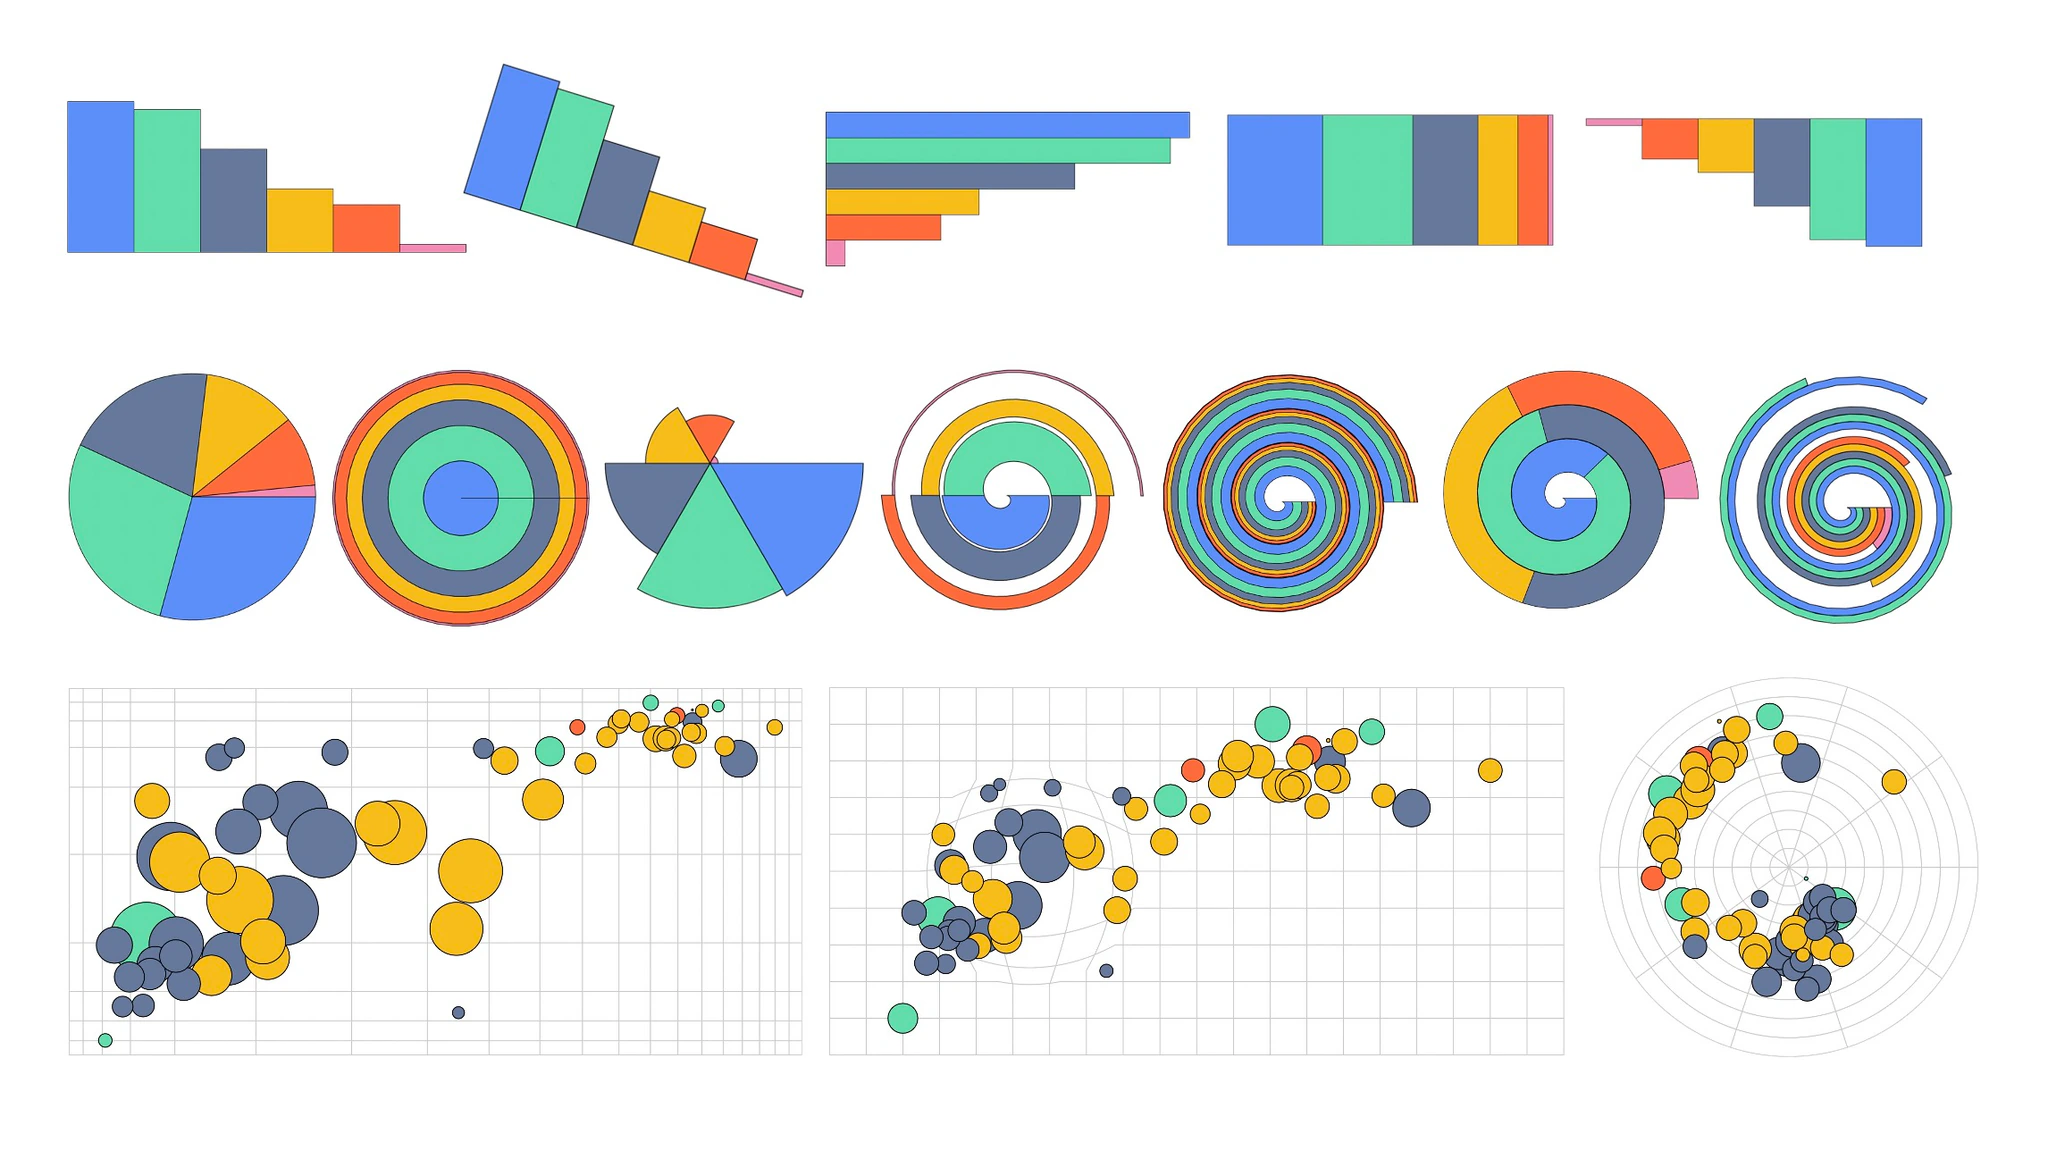 AntV Coord
Dual API styles
In the previous version, G2 only supports function API. Inspired by Vega, in order to make it more portable, declarative and structural, I designed the specification (spec) API, giving developers flexible ways to declare visualizations. For example, the following group bar charts can be declared in both function API and spec API in different styles:
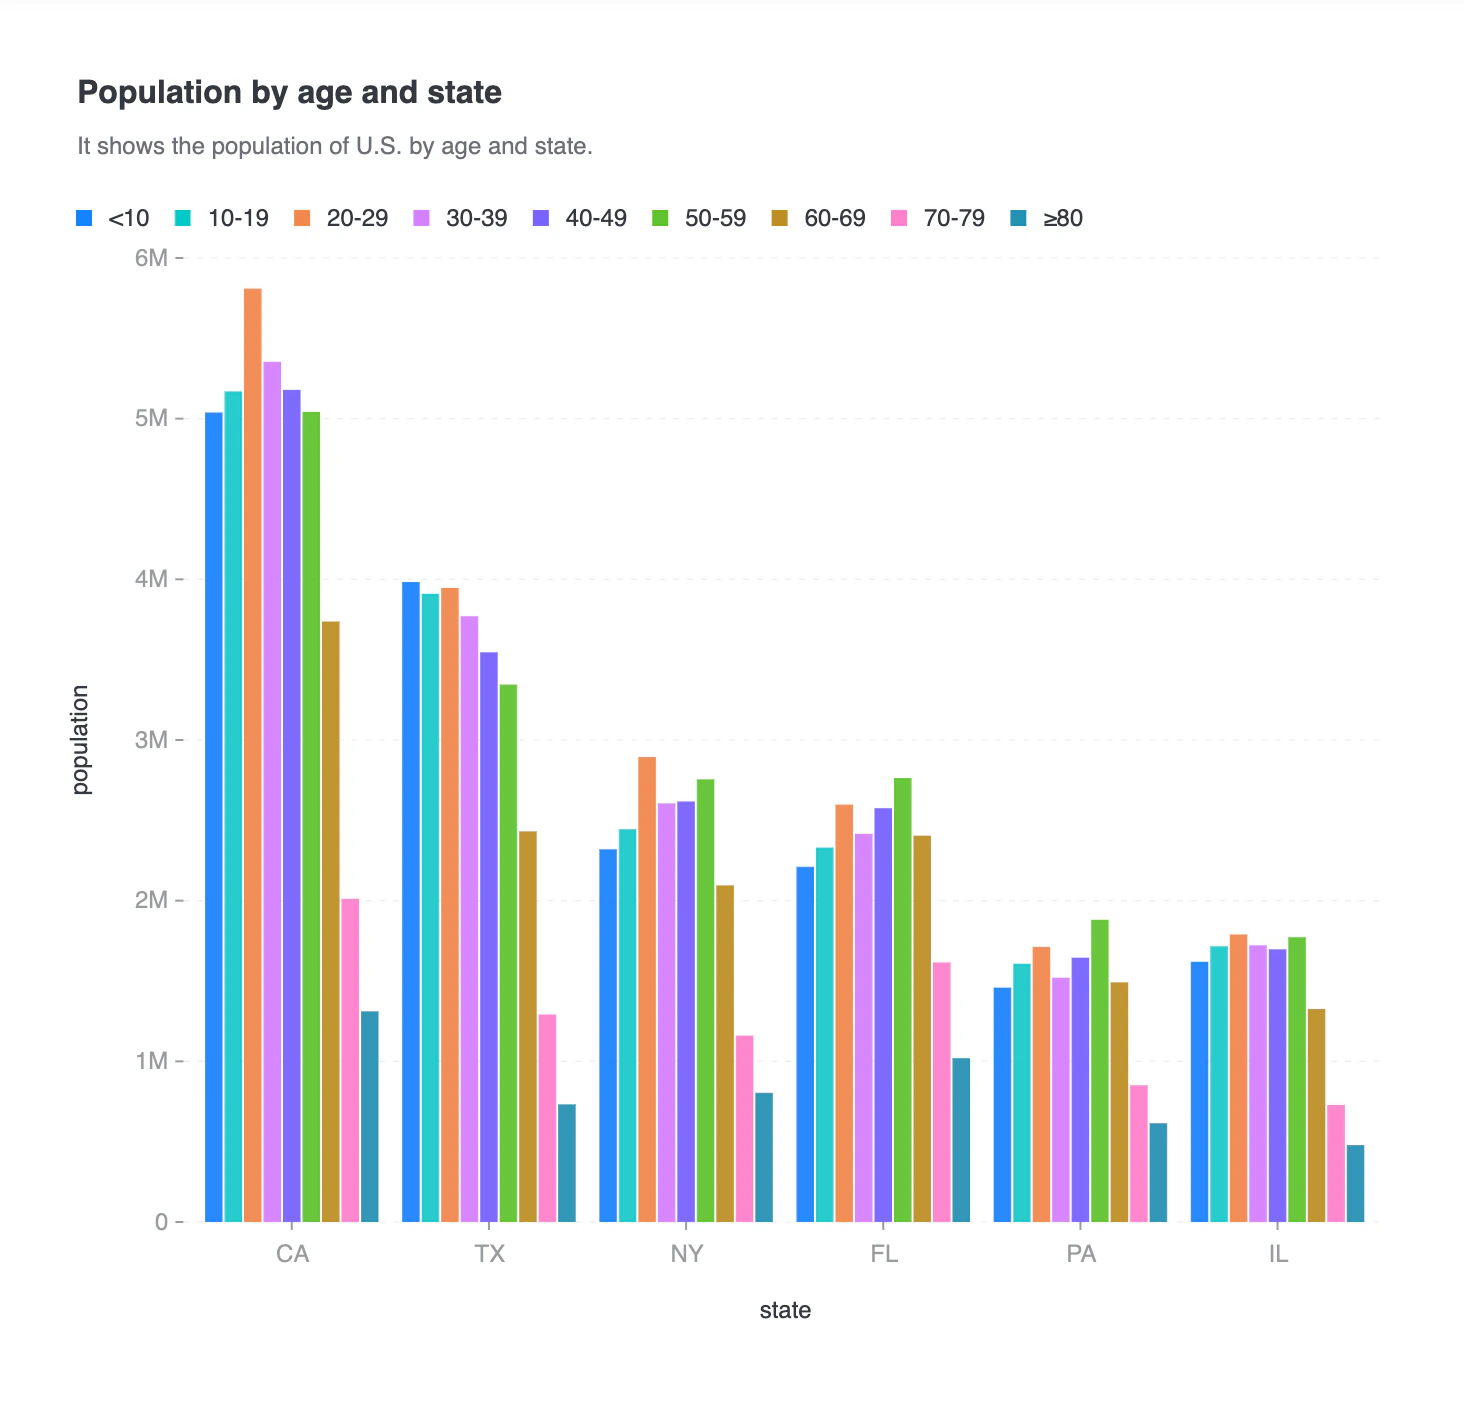 Group Bar Chart
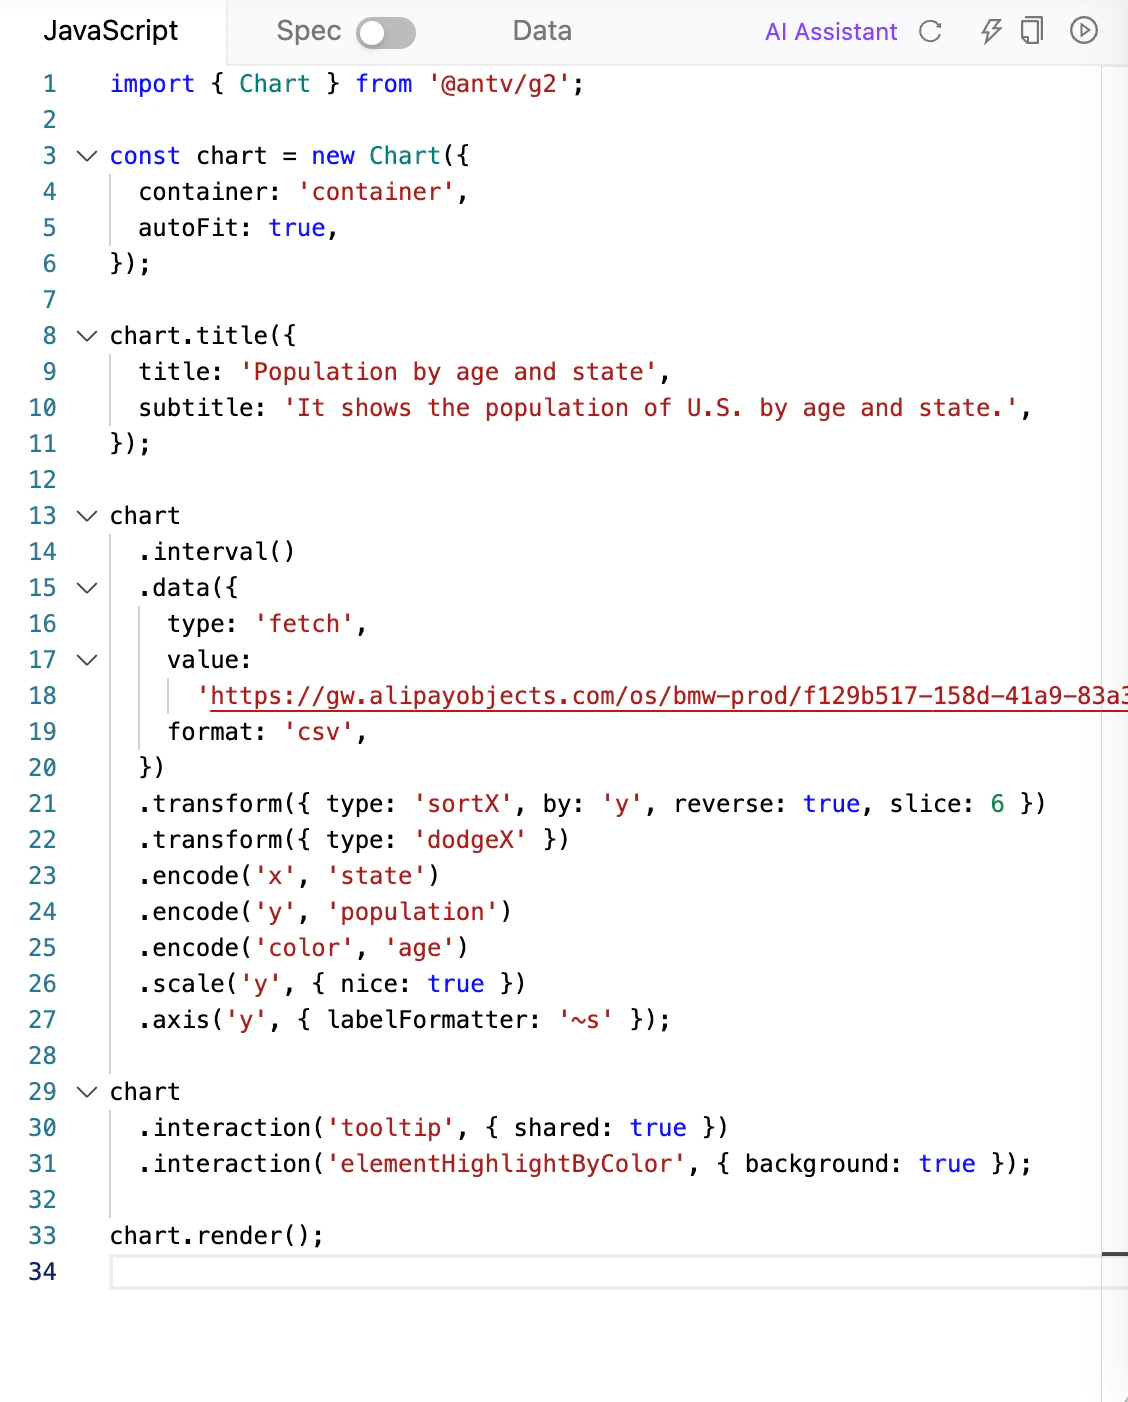 Function API
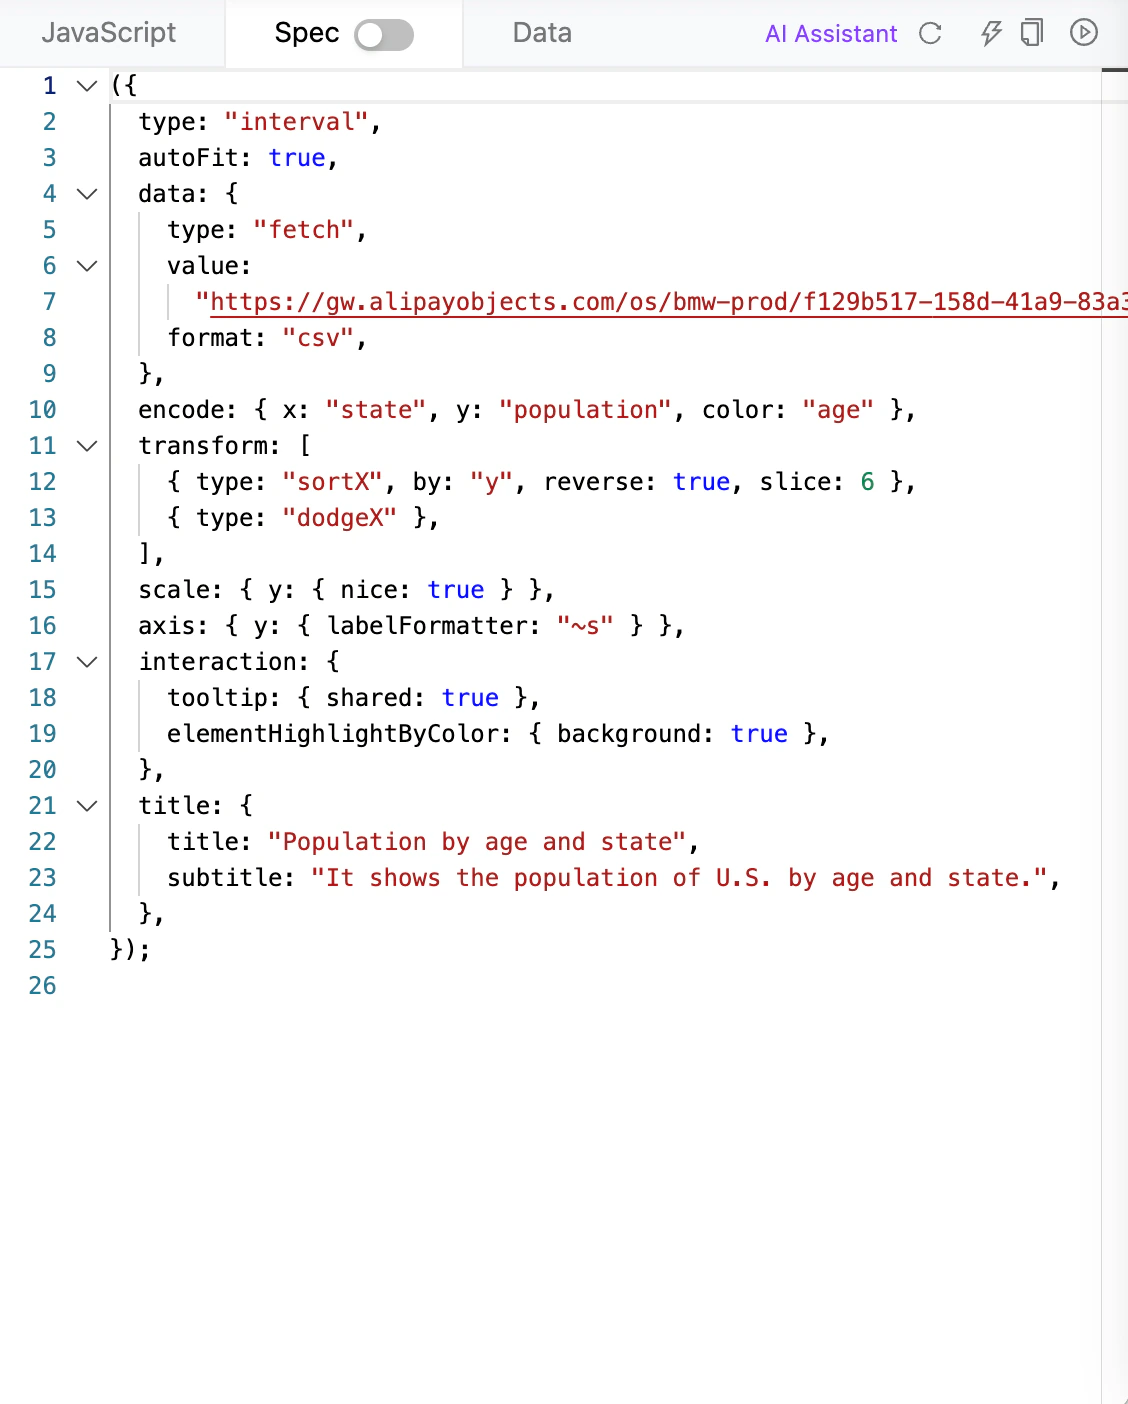 Spec API
Marks as first-class citizens
Inspired by Observable Plot, I unified geometries, annotations and components (axes, legends, titles, etc.) and designed composable marks, enabling consistent features and extensibility. In the past, G2 was limited to statistical charts. With the help of these new features, G2 can now be used to create a wide range of charts, including geographic maps, tree diagrams, graph visualizations and even 3D charts. Here are some examples:
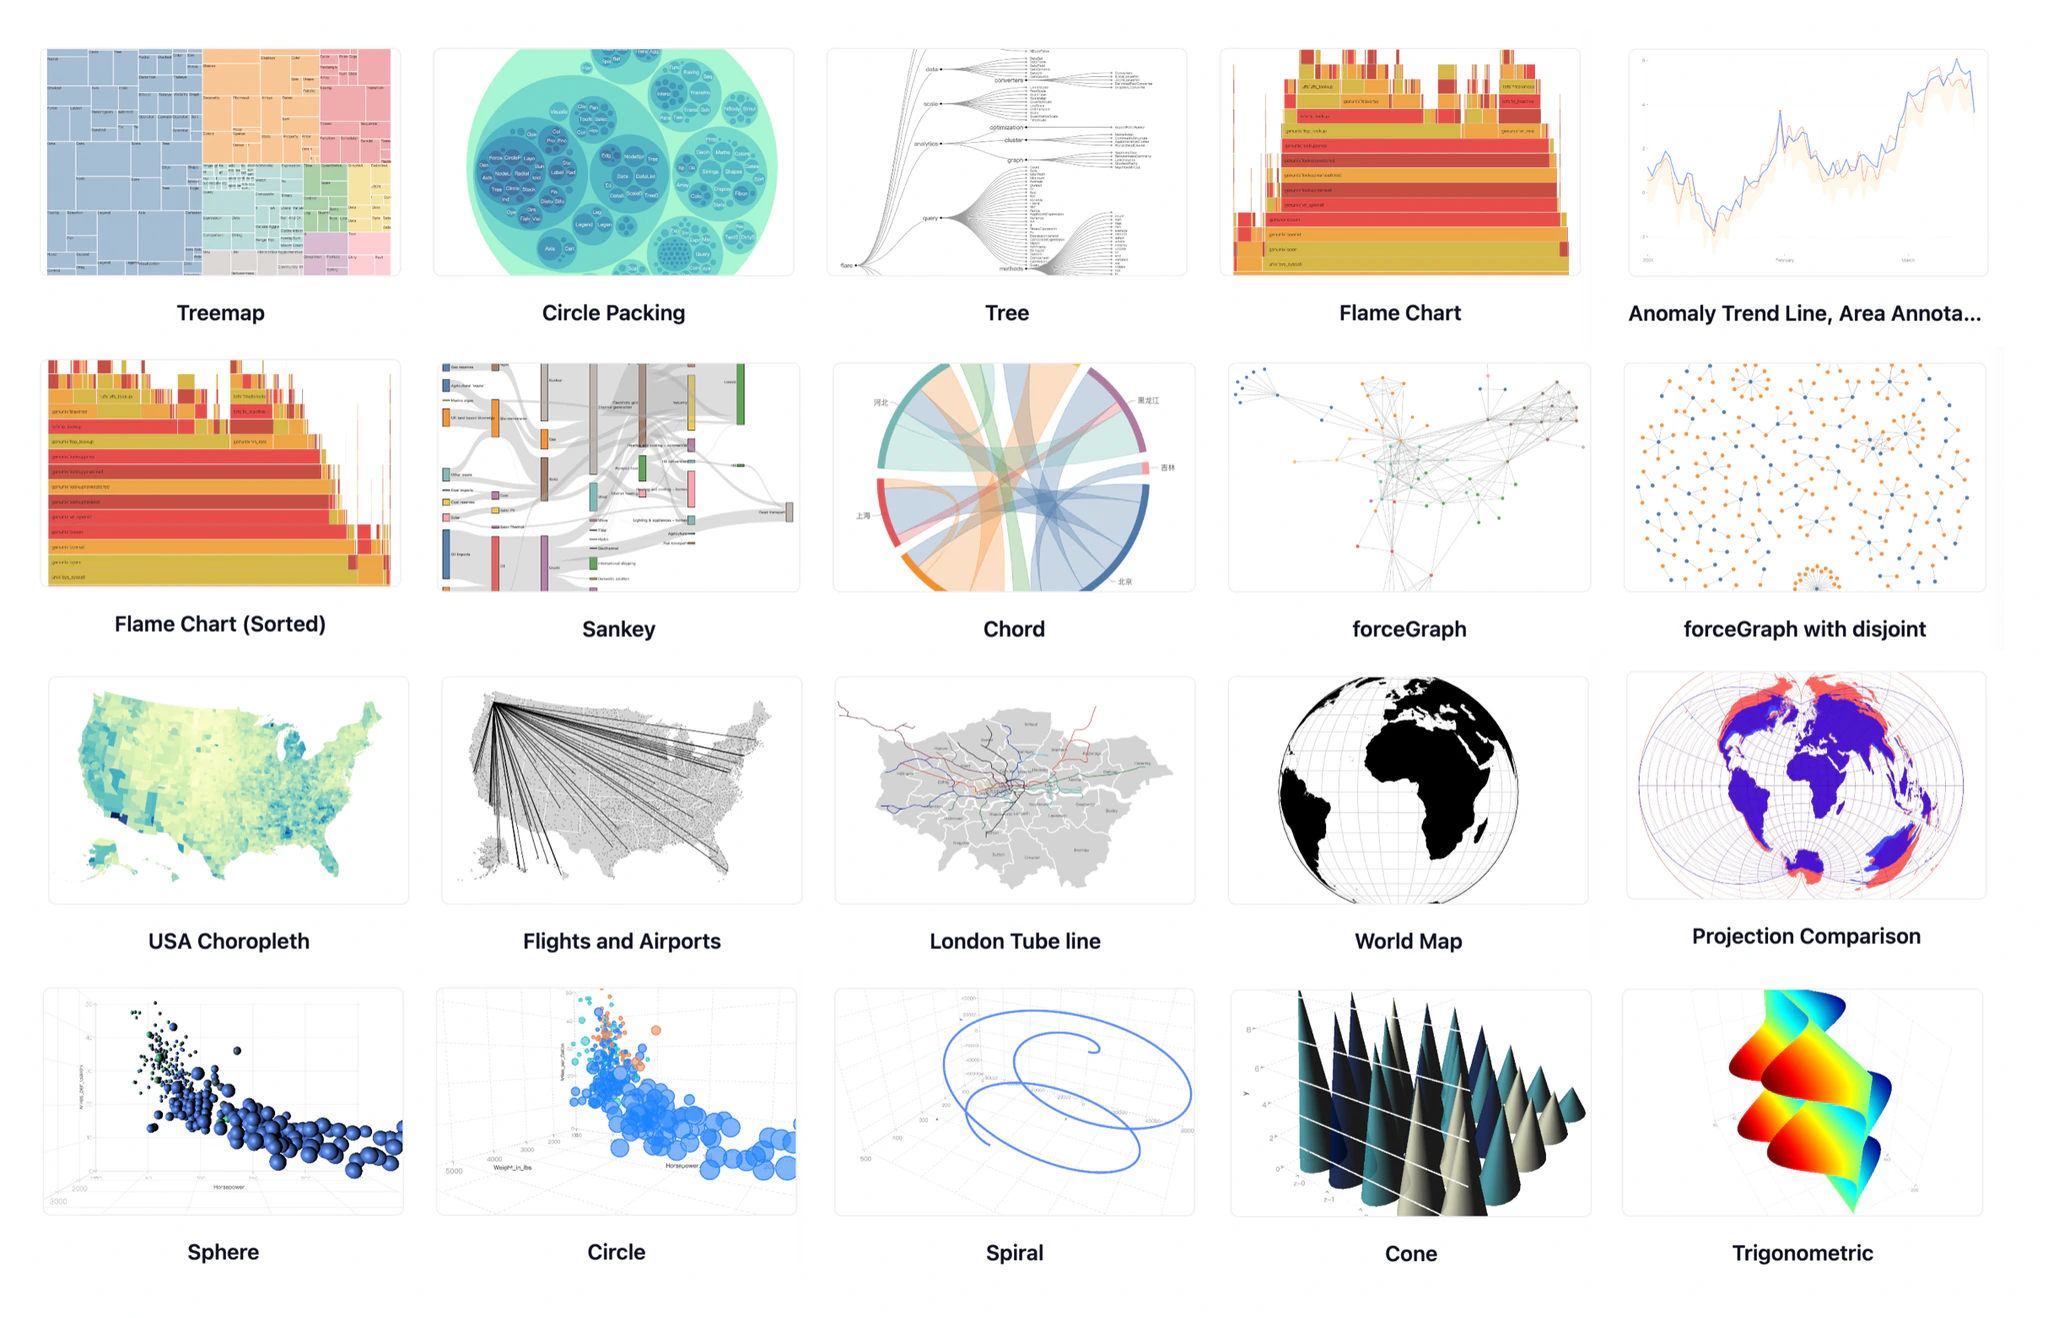 Composite Marks, Tree Diagram, Graph Visualization and 3D Chart
This also means G2 now supports a wide range of dual charts:
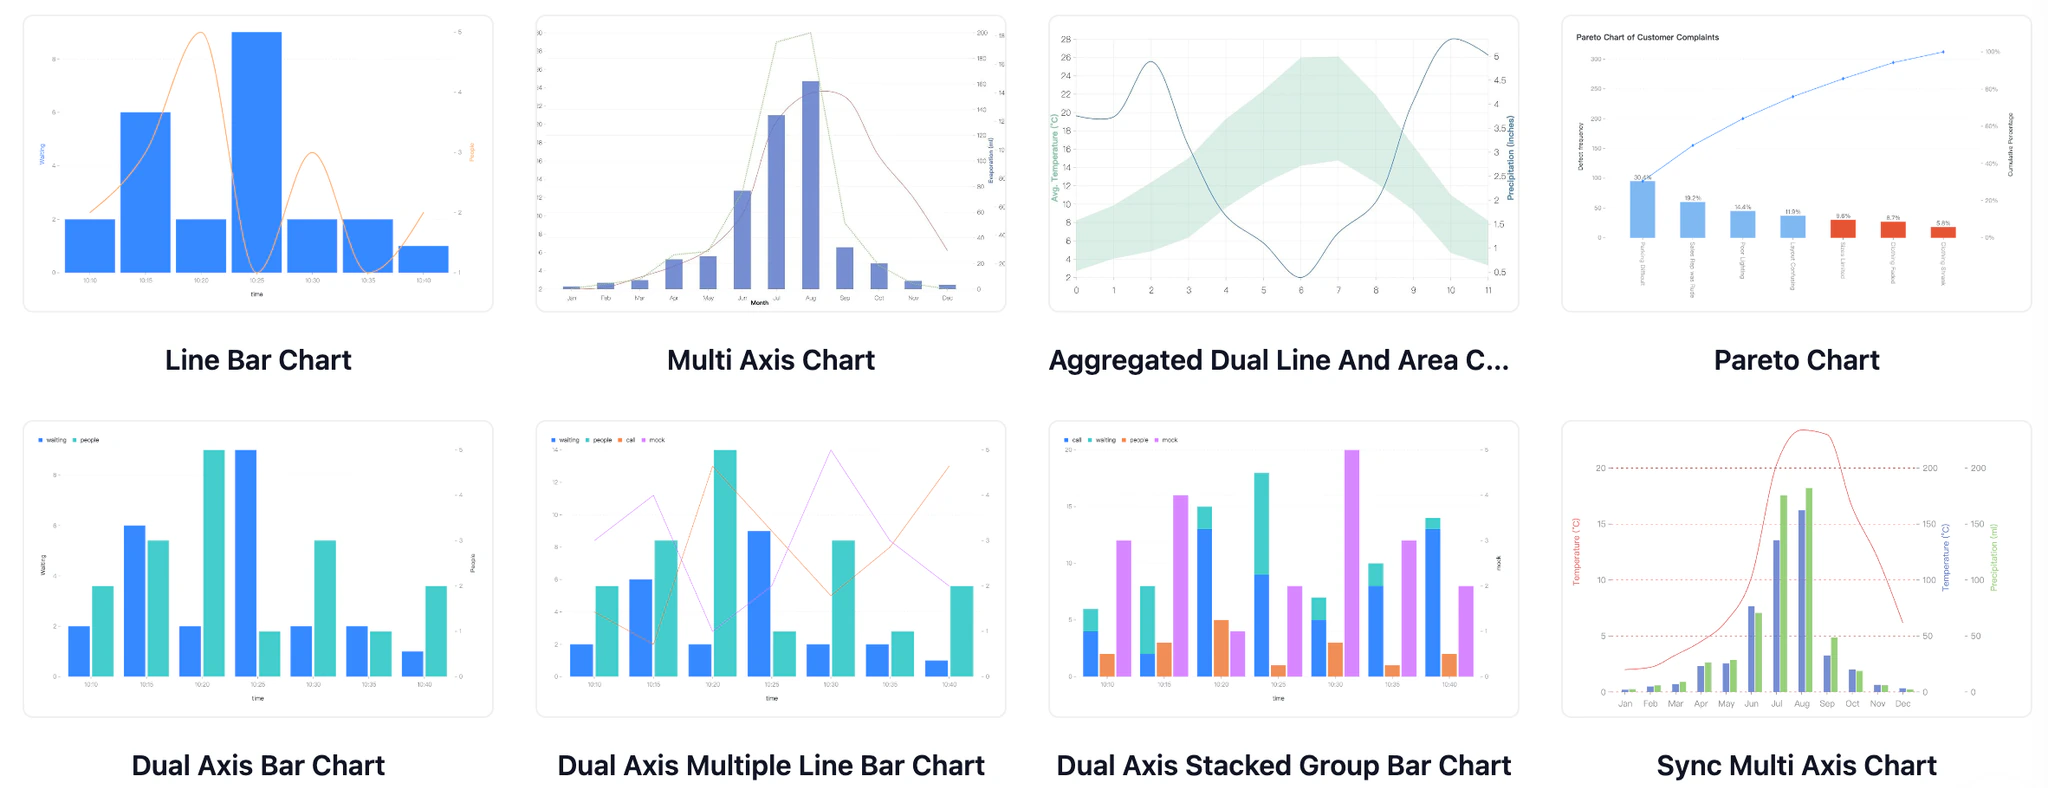 Dual Charts
Flattened transform API
Inspired by Observable Plot, we want G2 to support exploratory data analysis, so I designed the transform API to declare post-encoding transformations as arrays for simpler and more flexible data manipulation. Here are some examples:
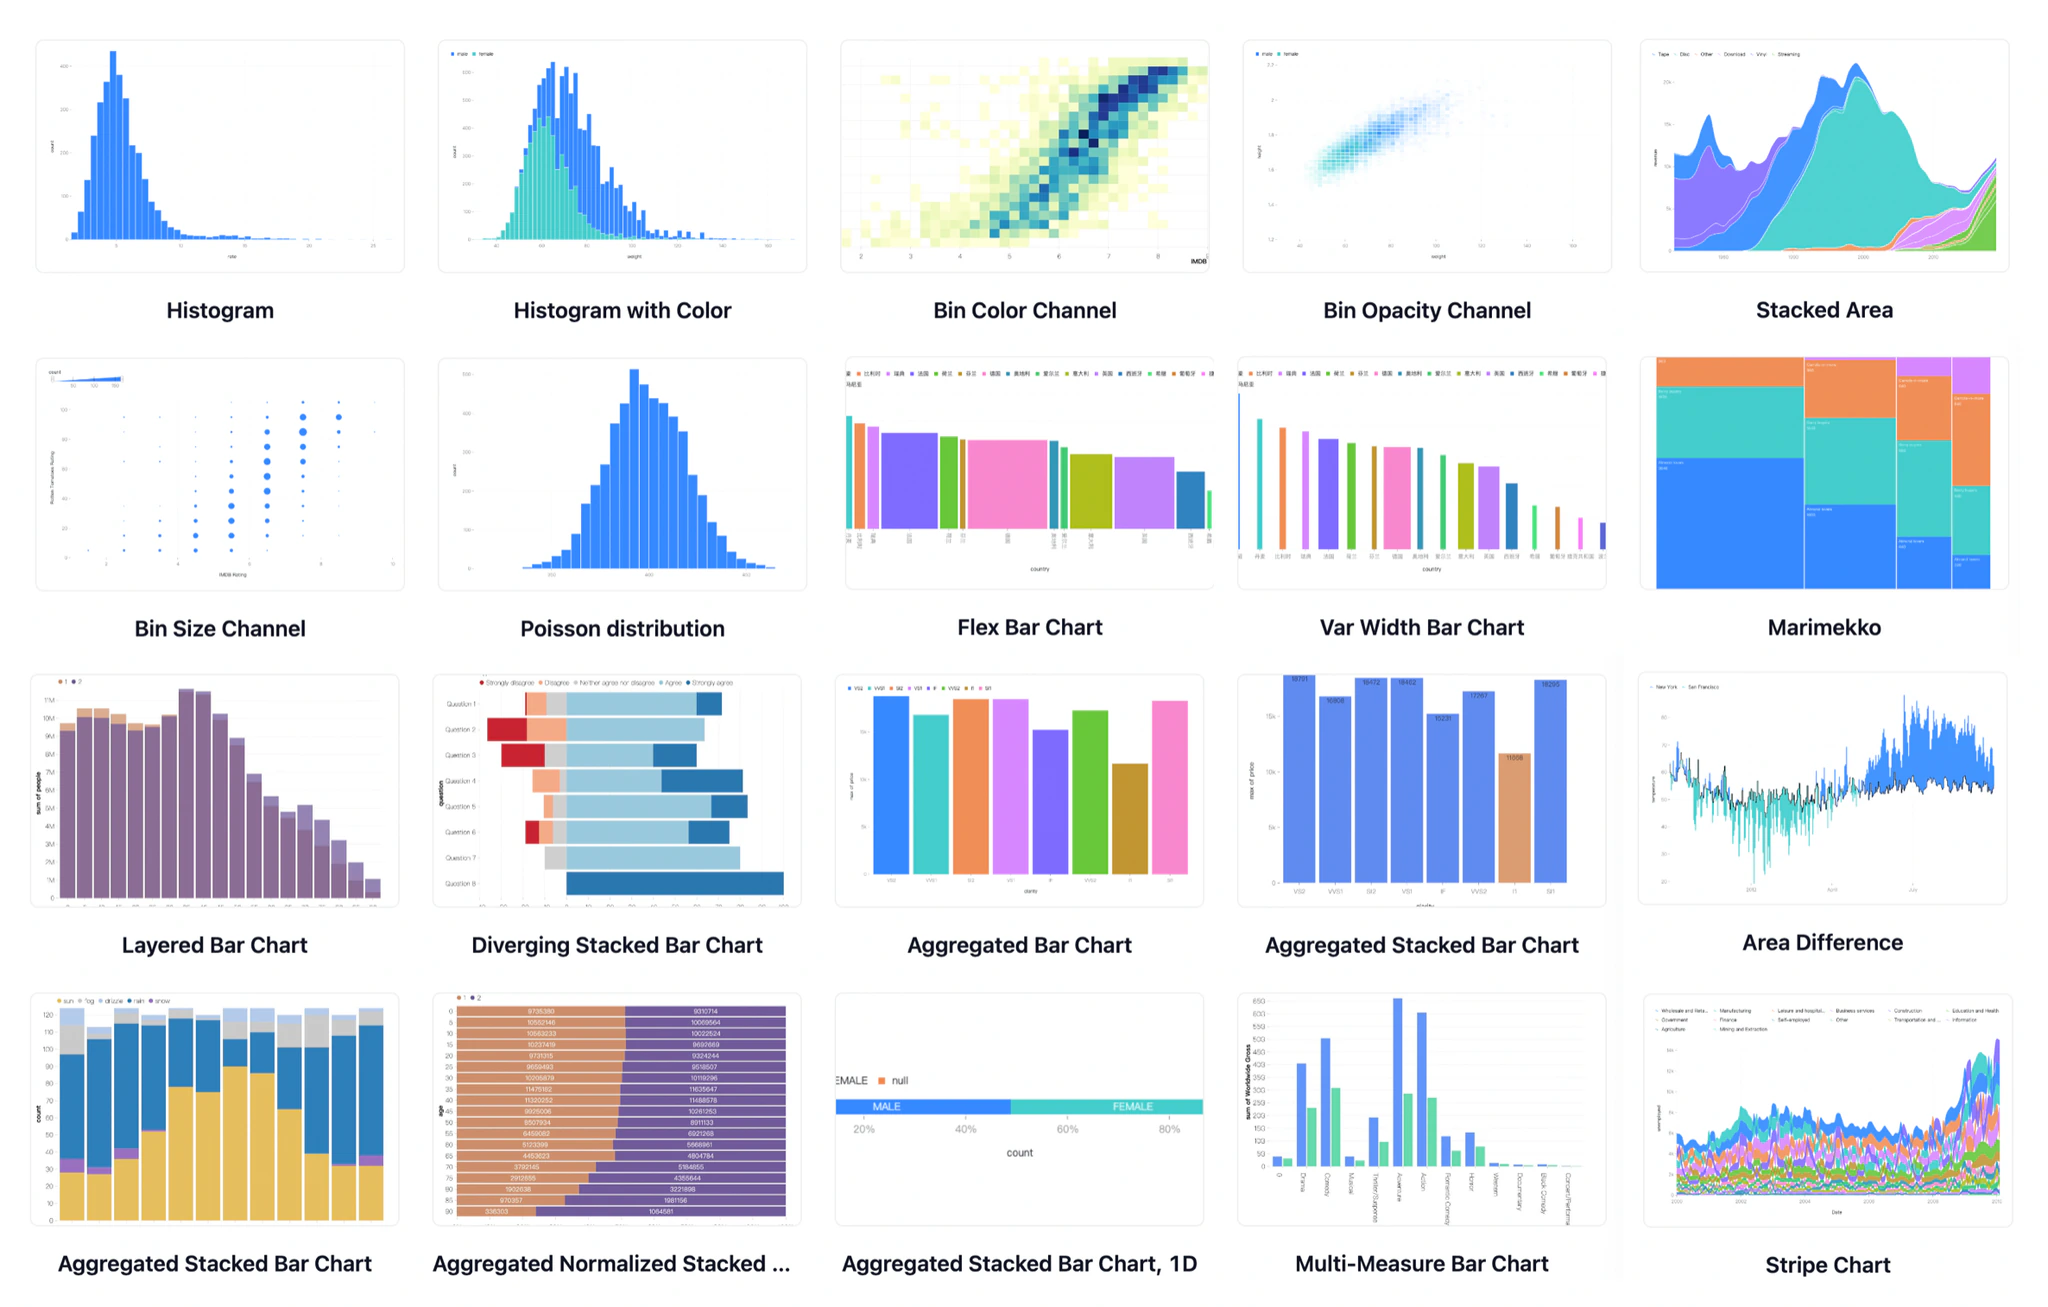 Transform Examples
Encodable animation properties
Data storytelling is a very interesting and powerful way to tell a story with data. Inspired by Canis, I designed the encodable animation properties to allow developers to easily animate data, allowing them to be transformed alongside visual elements.


View tree architecture
Inspired by Vega and Atom, I designed the view tree architecture to organize multiple views spatially and temporally, enhancing complex visualization composition. First, I designed flex, repeat and facet components to better support small multiples and faceted charts:
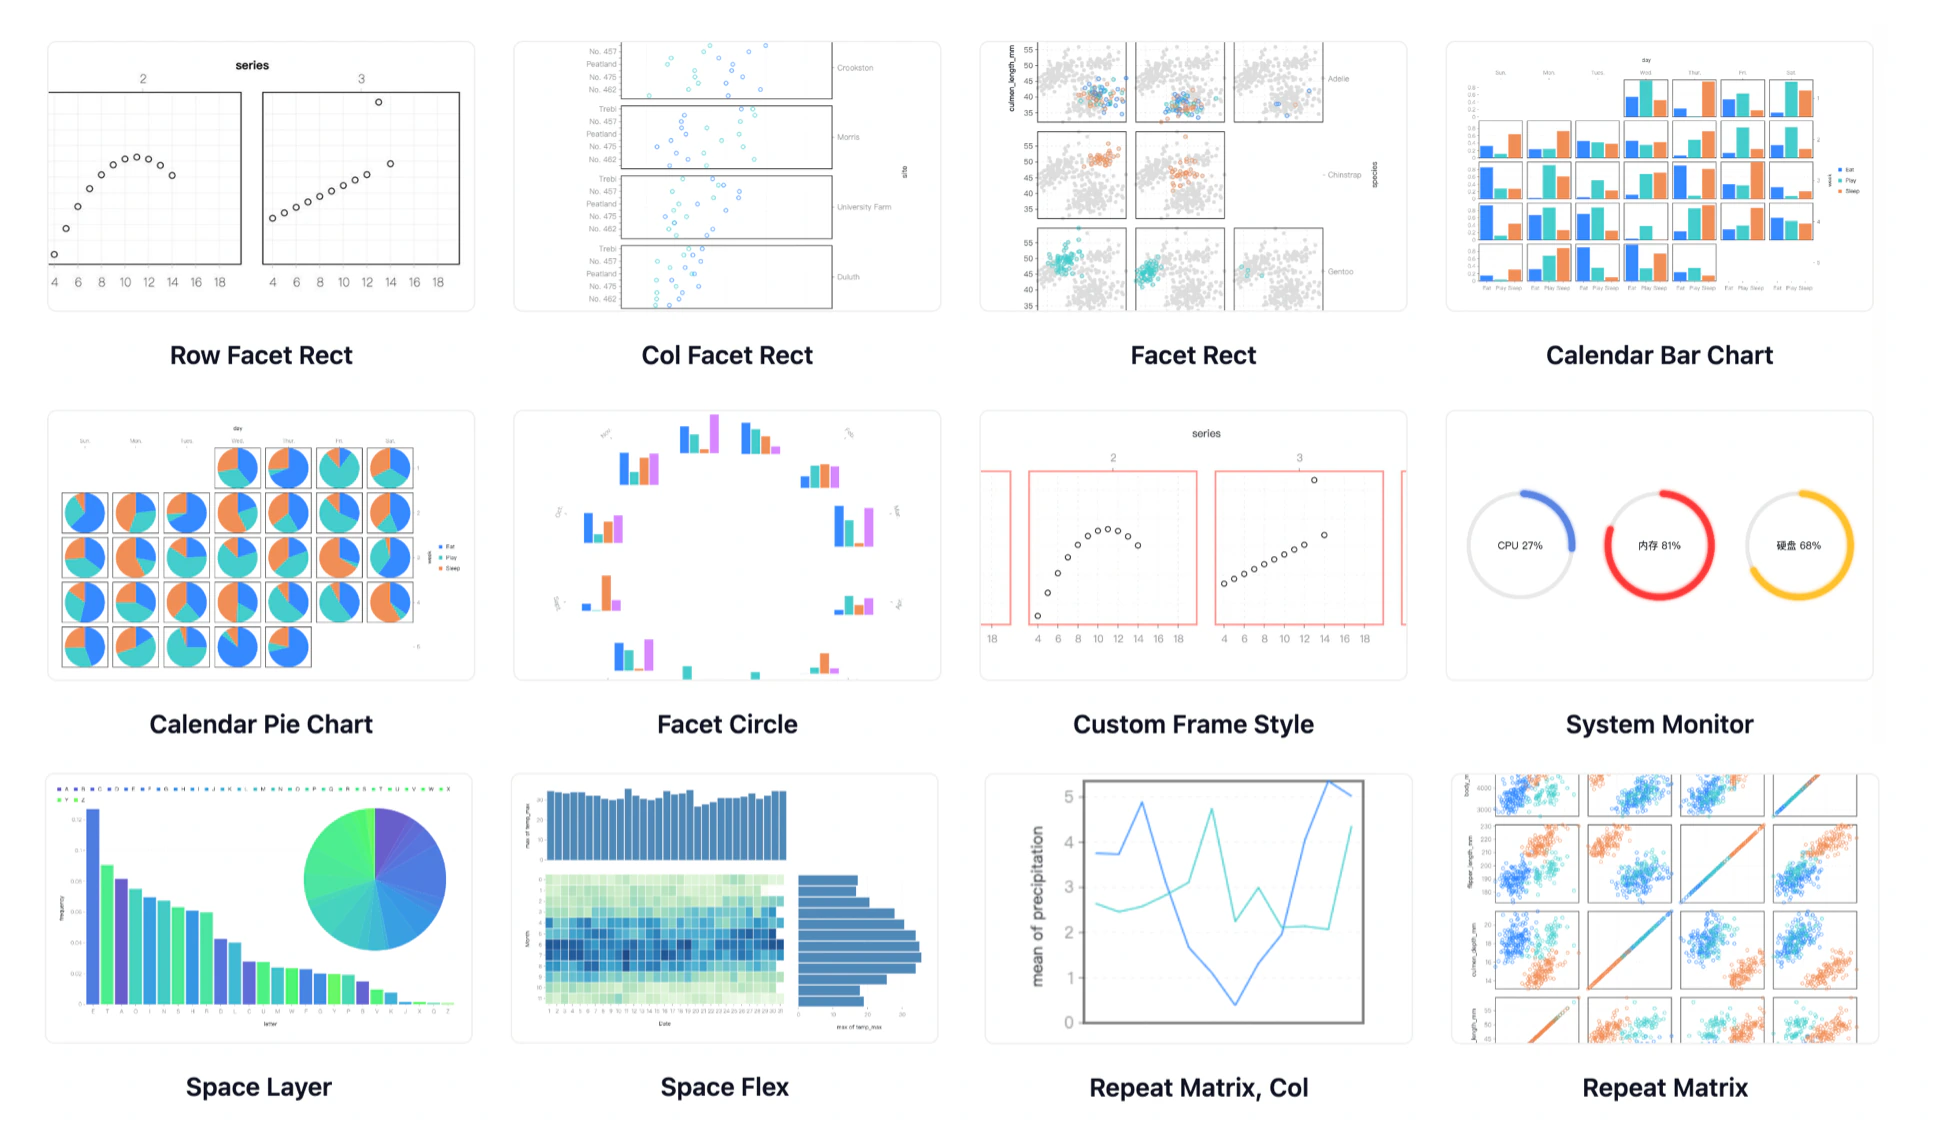 Facet
FacetThen, I made all composition components (flex, repeat, facet) can be nested, so that developers can create unit visualizations. Here are some examples based on the the Titanic dataset:
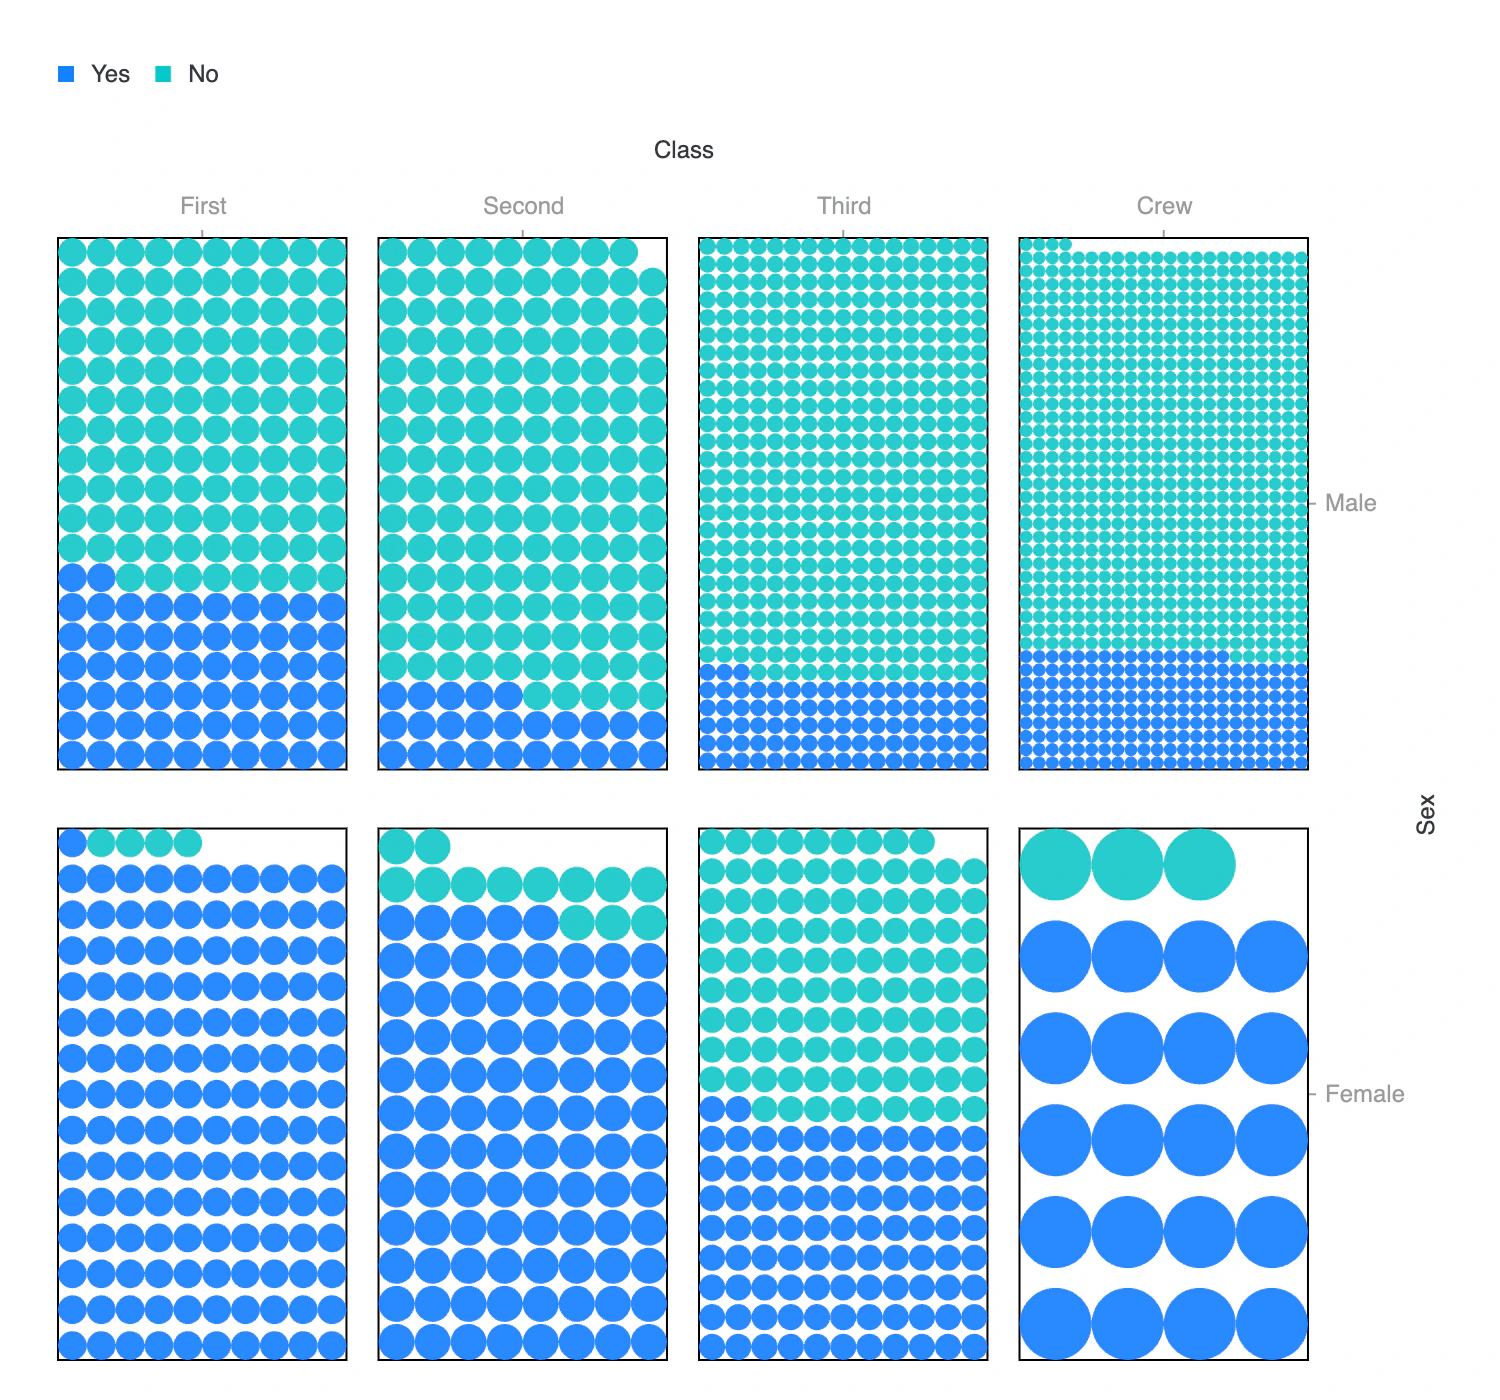 Titanic Unit Visualization 1
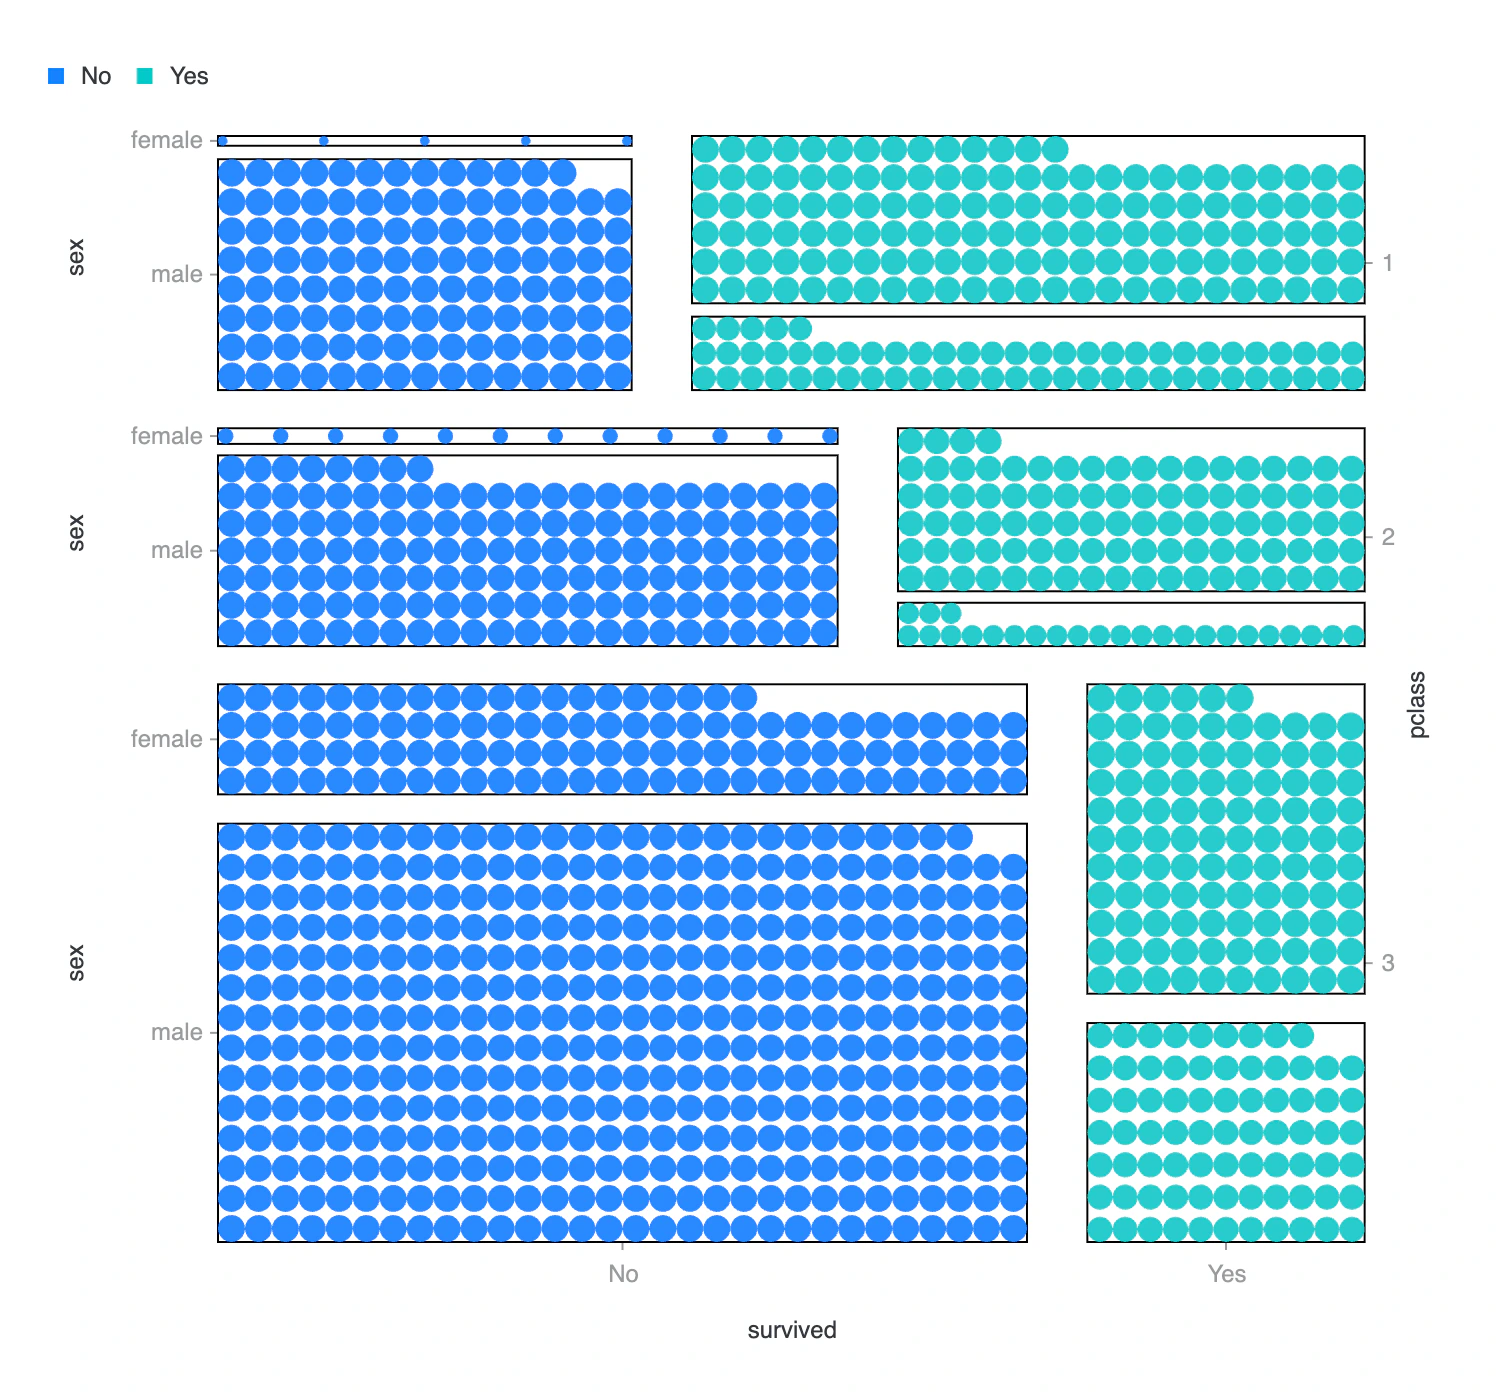 Titanic Unit Visualization 2
Surprisingly, this new architecture also enables keyframe animations. Here is a demo inspired by d3.js stock animations:
Reflection
Developing G2 5.0 has been a challenging and rewarding experience. It provided me with a solid technical foundation in building large-scale libraries, hands-on experience in maintaining an open-source community, and the opportunity to develop a systematic approach to designing creative tools from the ground up. But most importantly, it provided me with two important insights.
Teaching is the most effective way of tool shaping.
Before writing code, I spent nearly three months to write the tutorial I mentioned above, as well as examples for validating the design. They're both very helpful for organizing my thoughts and verifying the thoroughness of my design. Also, they serve as a means for users to quickly understand the tool's features and how to use it. Their feedback is also very valuable for me to improve the design.
Most things are data-driven.
When working with data visualization, you spend most of your time working with data. Data is typically numbers and can be used to represent most things. This observation also shapes how I think about generative art, which can typically be data-driven as well. This sparks my interest in data drive generative art: Name2Tree, APack, etc. I also started to explore a data-driven library for generative art: Charming.js.
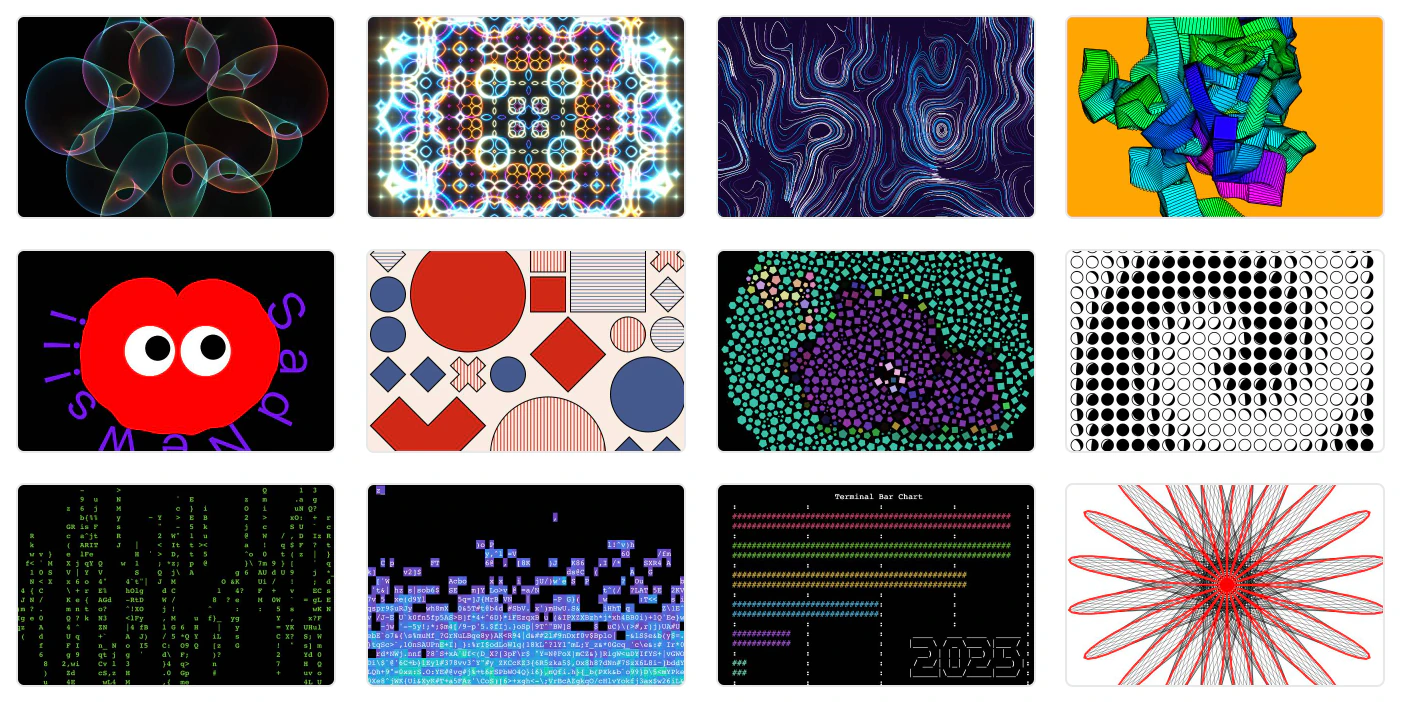 Examples of Charming.js
Acknowledgments
Special thanks to hustcc and visiky for their valuable insights and support in designing the new visualization grammar of G2 5.0 and for contributing to the implementation of several G2 5.0 modules.
References
- Visualization Analysis & Design - Tamara Munzner
- Observable Plot - A concise API for exploratory data visualization.
- Vega-Lite - A Visualization Grammar.
- Libra - An Instrument-Based Interaction Model for Data Visualization.
- Atom - A Grammar for Unit Visualizations.
- Canis - A High-level Language for Data-Driven Chart Animations.